This is the 2nd time this happened to me while working in n8n. (Server info: Digital Ocean -2cpu’s and 4gb of ram.)
For some odd reason, my CRU and IO seem to go extremely high out of the blue, and when I try to load n8n in the browser I get a blank page.
I have tried give it like 30 min to go back to normal but it doesn’t seem to work… so I end up rebooting the server and things seem to go back to normal.
Is this just me? how am I crashing n8n? is it my server?
is it a flow I am working on? (I don’t have so many running at the same time… )
From looking at your screenshot it also seems like the inbound network traffic correlates with the high CPU usage and Disk I/O. The high CPU usage from your screenshot shows the majority of resource being used for “sys” operations. My understanding is that this would be code executed by kernel operations, so it doesn’t look like n8n is the actual cause for the high load here (but then again I am not a digital ocean user, so these charts might show something different).
If it’s not you sending large amounts of data to your n8n instance, my first step would be to identify the source of this traffic.
I’d then try and track down the CPU usage. I usually take a look at htop or docker stats first (obviously, the latter only makes sense if you are managing your applications using docker).
Neither rebooting nor updating to the newest version worked for me, but what did work was deactivating all the active processes for about an hour and a half and switching them back on. I don’t think it’s necessary to wait that long, but you’d have to see for yourself.
I think that it might have been the fault of all the triggers, set to listen and poll every minute or a few.
I am running n8n with docker hosted on Hetzner.
I think that cpu and network traffic loads might be building over time with many workflows using (Google) trigger nodes that poll every minute.
How are you doing the monitoring, like is it the container you are checking or the OS? I would expect the network to slowly increase over time but each call would in theory use the same amount unless there is more data coming back.
cpu could spike over time if you are adding more workflows but it all depends on what the workflows are actually doing.
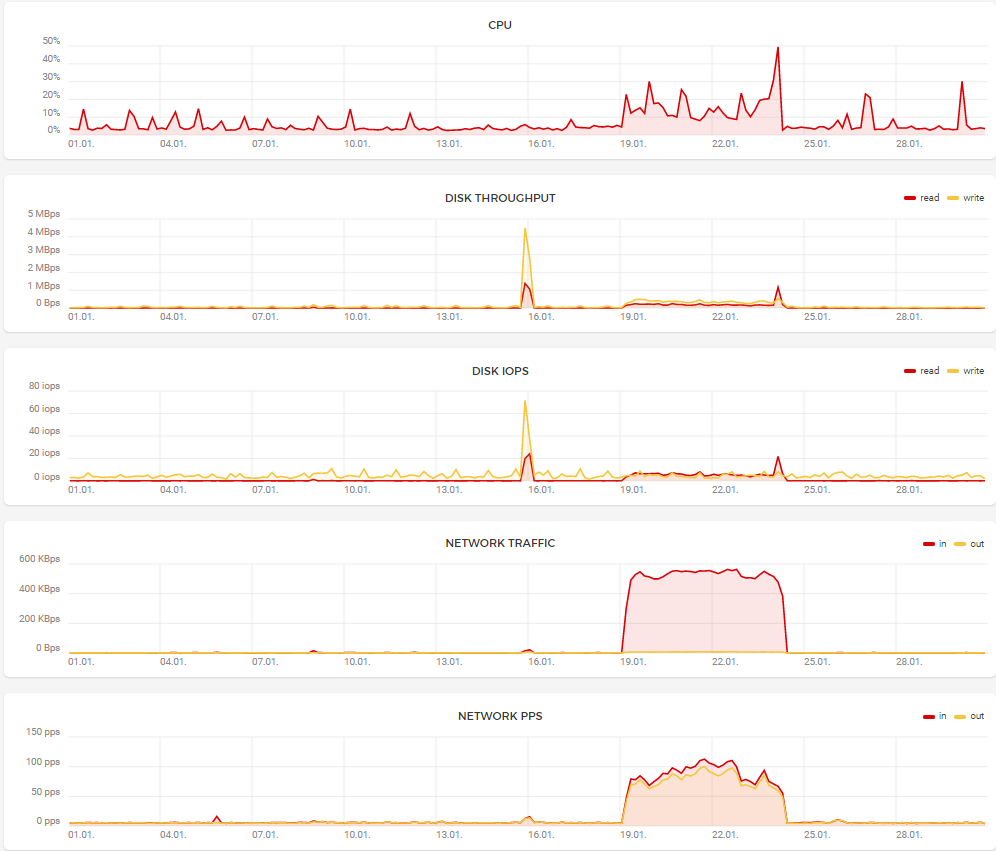
Hetzner provides graphs where you can monitor server use.
Here is the 30-day history, as you can see there is a visible increase in CPU massive and Disk use and a massive Network traffic increase between 19.01.22 and 24.01.22.
To be honest I am not seeing anything there that I would be worried about, The network traffic would suggest something was making some network calls which I would expect to see an increase in CPU usage for.
getaddrinfo EAI_AGAIN typically points to a network / DNS issue where the lookup has timed out. I would keep an eye on it and and the workflows to make sure everything is still running smoothly.
The CPU usage is definitely correlated with the Network traffic and I think “Google Drive trigger” node was causing it.
It happened again and as I did before, I turned off all the active workflows, waited about 15 minutes until came back to regular levels and started turning them back on one by one to see which one was causing trouble.
When I turned on the workflow with “Google Drive trigger” node, the Network traffic and CPU usage went back up.
I replaced it with “Google sheet trigger” node now (which I don’t think was available at the time when I made the workflow) and everything has been working fine for the past hour or so.
The increased traffic caused all sorts of problems, as you might imagine:
the general sluggishness of UI,
workflows couldn’t complete as they ran out of memory,
(not to mention) the “Google Drive trigger” even not activating the workflow.
getaddrinfo EAI_AGAIN issue has also subsided, so I hope this info helps.
I suspect part of it could be down to the amount of items in Google Drive, It looks like we just list out the contents of Drive based on the polling frequency. I think Sheets uses a different approach so overall it should be less network requests which is always good.
The DNS error may come back again so it would be worth keeping an eye on it but it is nice to know things are looking good