Apparently my main process is receiving incoming Webhook requests at very random rate(1 o 2 request every 3 minutes). While my Webhooks processors continuously receiving incoming requests at 60+ requests per seconds.
I already checked the main process with tcpdump, and I don’t see any HTTP request coming from the load balancer. The Workflow started in the main process are Production Webhook Triggered and aren’t duplicates in any of the Webhook processors.
So I’m wondering where are those requests coming from?
Setup:
I’m using Traefik routing with 1 main process, 2 Webhook processors and 4 workers.
Then it will be a workflow that does not use a Webhook based trigger, rather any other trigger that exists like Interval, Cron, RabbitMQ, all the ones that use polling,…
hm super strange. Then I am sadly out of ideas for now.
I am only certain that n8n does not make up API requests by itself. So would still expect that it receives something. If you say that tcpdump does not show anything, then it must receive it via a different network or something like that.
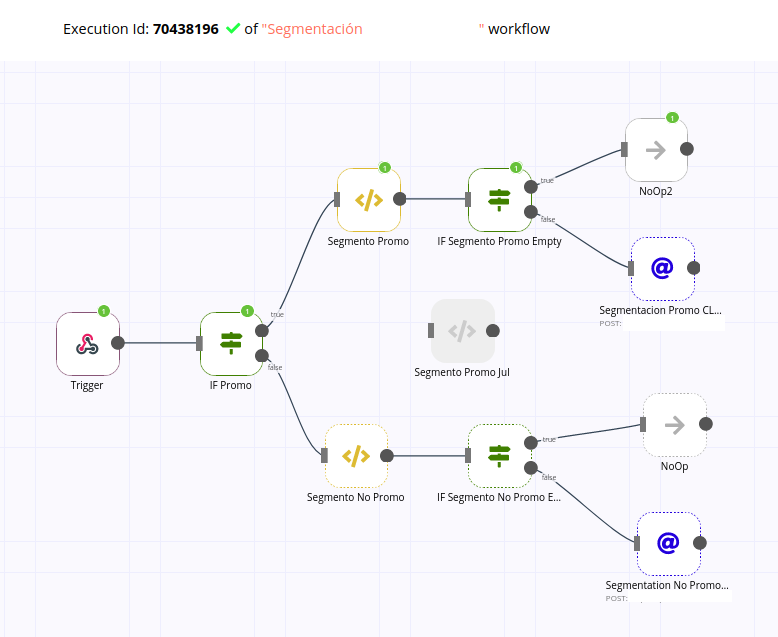
Does looking at the data the Trigger received help to clear that up?
After more testing and debugging, I think I found something interesting
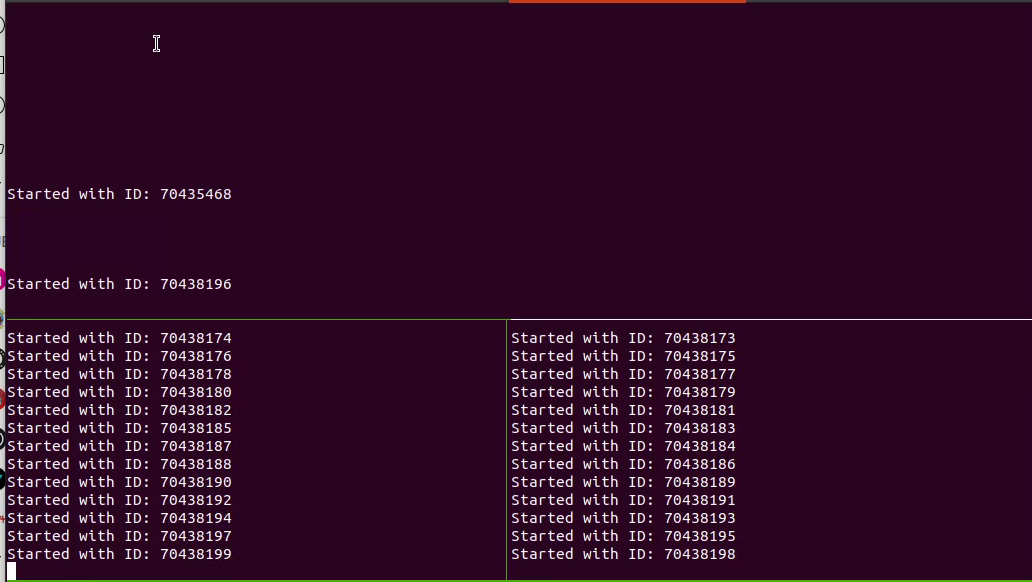
I stopped the high traffic Webhook call(let say its the workflow 20), and the main process with N8N_LOG_LEVEL=debug.
The main process is executing workflow 10 and workflow 15 which are RabbitMQ and Time Interval triggers(works as expected). And none of them was from a Webhook(I still have some others low traffic webhook enabled and are executed in the webhook processors as expected too).
But with high traffic those non Webhook workflows was not showing in n8n main process. Which let me suspect that the n8n main process is still executing those non Webhook workflows but showing an incorrect Execution Id.
If you have some insight about this possible behavior let me know. In the mean time I will try to replicate it in a sandbox to validate my suspicion