Hi @dickhoning, I wonder if having these massive logs open in the Docker Desktop UI might contribute to the overall problem.
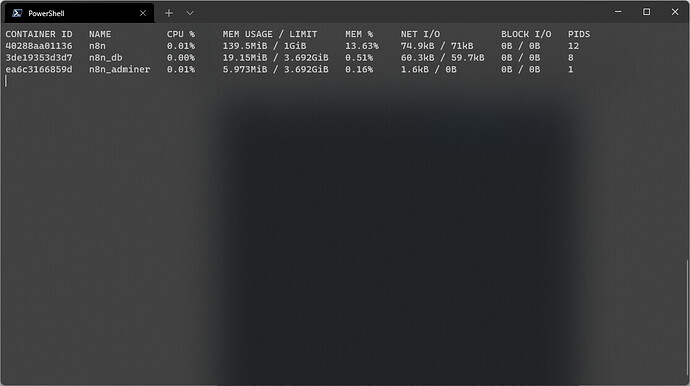
Could you avoid opening it and run docker stats in your terminal? This should give you a good view of the memory consumption for your docker containers without processing potentially huge logs:
On the problem itself: The gibberish looks like the contents of a file buffer. From our DM I understand that while you’re processing binary data it is actually coming through inside the JSON body of a webhook. While we have recently introduced a new approach to processing binary data and avoid keeping it in memory, this doesn’t apply to JSON data.
This means that your data is passed on from node to node and constantly kept in memory in the process (meaning more nodes = more memory being eaten up). There are other factors too (e.g. executing a workflow manually will drive up the memory consumption as data is kept available for the UI).
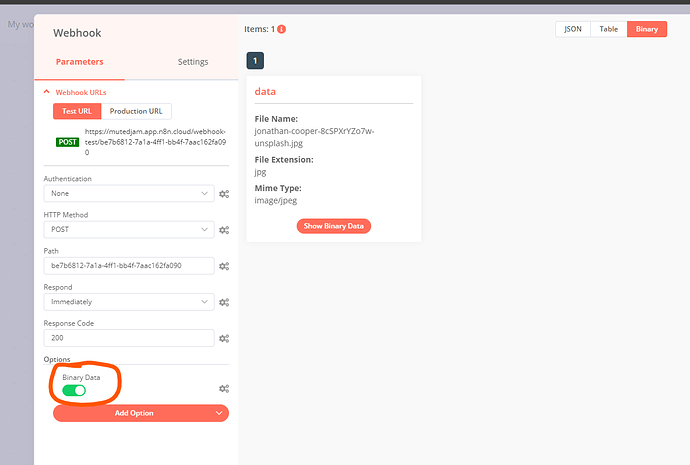
So to reduce memory consumption in this rather unusual scenario you might want to look at whether you can avoid processing the binary data as JSON data. When using the Webhook node, you can enable the Binary Data toggle:
Now when sending through a file as part of a multipart form request, it should appear in n8n as binary data rather than JSON data. Combined with the approach linked above (setting N8N_DEFAULT_BINARY_DATA_MODE=filesystem) this should significantly reduce the memory consumption.
You can still read the file in your custom code as needed, but keep it out of the JSON data. Here’s an example workflow showing the basic idea here:
Example Workflow
Hope this provided some pointers as to where to go next.

