I am running into an issue debugging a playbook, and while I figured out the issue, a few UI changes would help tremendously to avoid this in the future.
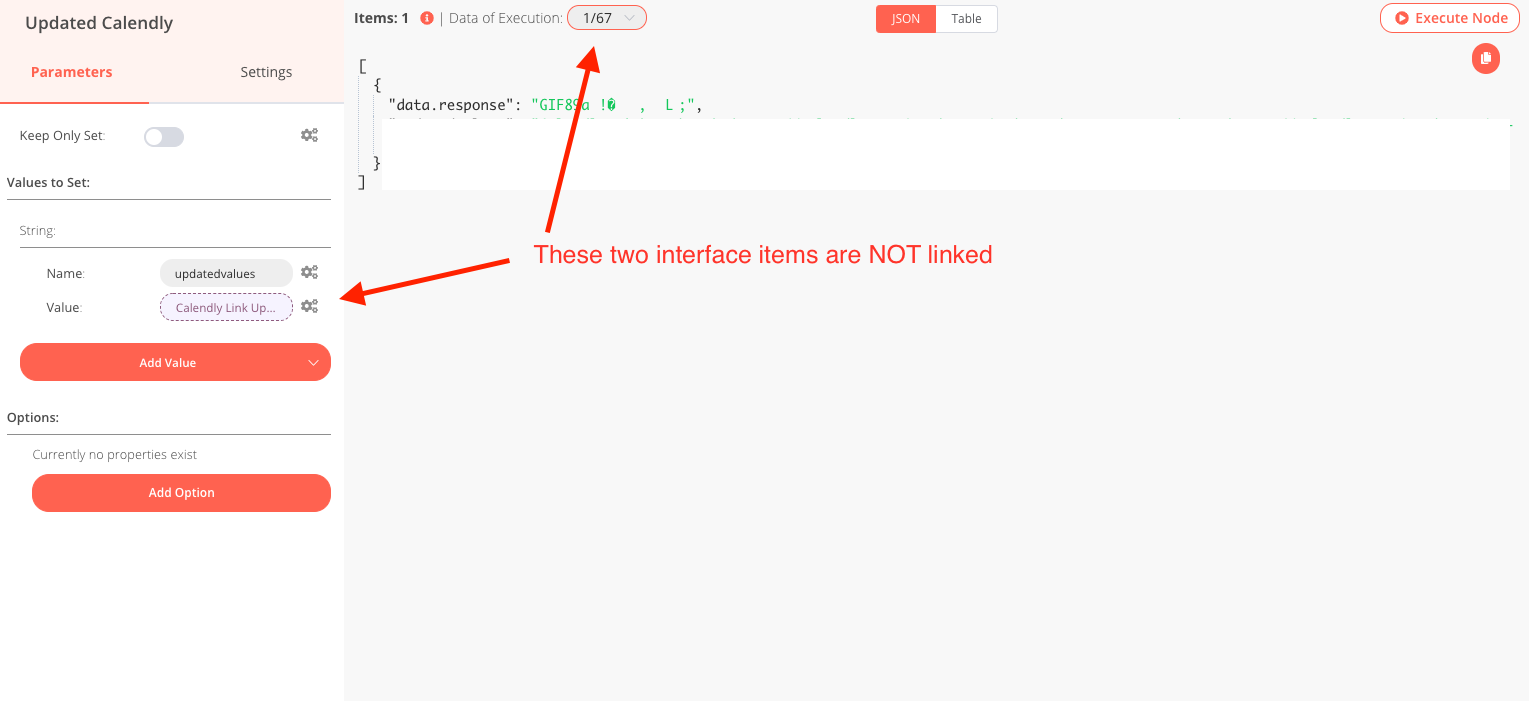
On the left-hand side of the node editing screen, you see the input values. The purple fields designate expressions, which then show a preview of a value. On the right, you see the actual JSON data outputs, and you can even switch the index on the Data of Execution.
I would find it useful to see the previews on the left pane update with the values of the selected index so you can see which execution fired incorrectly. I’m having trouble debugging a workflow containing an HTTP client Node currently because the api outputs a single image file every time you submit a post, whether it was correct or not, so I can’t validate based on the output of the node, so I need to figure out why my executions are being sent incorrectly.
As an alternative, being able to see the Input VS the Output on each node would help tremendously as well.
Thank you for your consideration, this is still an amazing platform and I appreciate all your work and dedication to the platform.