Lab results come back as PDFs. Most people open them, skim for anything highlighted in red, close the file, and move on. The actual values — glucose, cholesterol, thyroid, CBC panel — get forgotten by the next appointment. When a doctor asks “how has your HbA1c been trending?” the honest answer is usually “I don’t know.”
For healthcare providers or wellness coaches tracking results across multiple patients, the problem is operational. Opening each PDF, reading through 20-30 individual test values, flagging anything outside range, logging it somewhere — that’s 15-20 minutes per patient per result set.
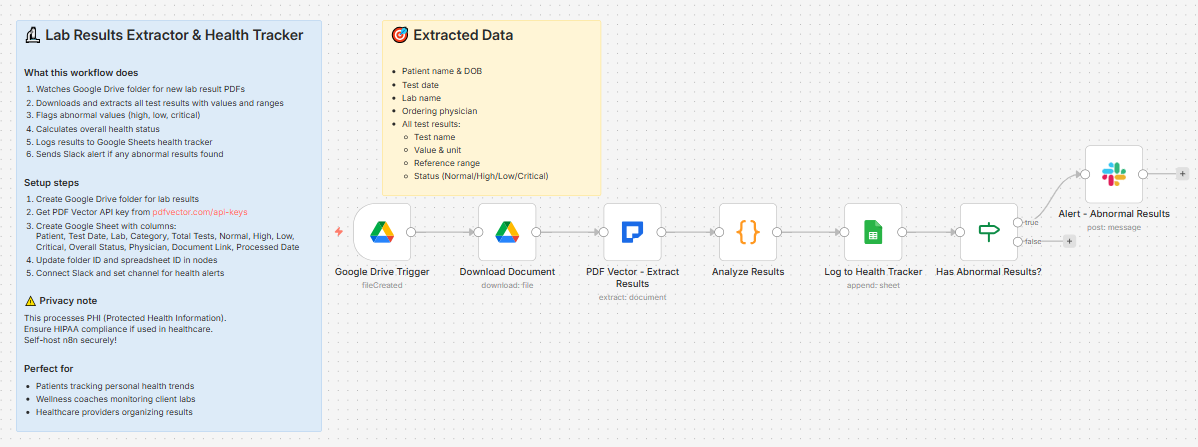
Built a workflow that extracts every test result the moment a lab PDF lands in Drive, flags anything abnormal, and fires a Slack alert if anything needs attention.
What it does
Lab PDF dropped in Google Drive → extracts all test results with values and reference ranges → flags abnormal values → calculates overall status → logs to health tracker → fires Slack alert if any abnormal results found
Takes about 10-12 seconds per document.
What gets extracted
Patient info:
- Name, date of birth, patient ID
Lab info:
-
Test date, report date
-
Lab name and address
-
Ordering physician
For every individual test result:
-
Test name
-
Numeric value and unit
-
Reference range (low and high)
-
Status — Normal / High / Low / Critical High / Critical Low / Abnormal
Abnormal flagging and status
The Code node counts results by status and determines an overall health status:
-
Any Critical results → “Critical - Action Required”

-
More than 3 High or Low results → “Multiple Abnormal - Review Needed”

-
1-3 High or Low results → “Some Abnormal Values”
-
All normal → “Normal”

Only results with at least one abnormal value trigger a Slack alert. Clean results are logged silently.
What lands in Slack (abnormal results only)
⚠️ Lab Results Alert

Patient: Michael Torres

Test Date: 2025-03-14

Lab: Quest Diagnostics

Physician: Dr. Sarah Kim

📊 Results Summary:

• Total Tests: 22

• Normal: 18

• High: 3

• Low: 1

• Critical: 0

⚠️ Overall Status: Some Abnormal Values

Abnormal Results:

⚠️ Glucose: 118 mg/dL (High) [Ref: 70-99]

⚠️ LDL Cholesterol: 142 mg/dL (High) [Ref: 0-99]

⚠️ Triglycerides: 186 mg/dL (High) [Ref: 0-149]

⚠️ HDL Cholesterol: 38 mg/dL (Low) [Ref: 40-60]

📄 View Lab Report
Each abnormal result shows the actual value, status, and reference range in the same line.
What lands in Google Sheets
Each row: Patient, Test Date, Lab, Category, Total Tests, Normal (count), High (count), Low (count), Critical (count), Overall Status, Physician, Document Link, Processed Date
Filter by Overall Status to see all results that need follow-up. Sort by Test Date per patient to track trends over time.
Setup
You’ll need:
-
Google Drive (folder for lab result PDFs)
-
Google Sheets (free)
-
n8n instance (self-hosted — required for both PDF Vector community node and PHI handling)
-
PDF Vector account (free tier: 100 credits/month)
-
Slack (for abnormal result alerts)
About 15 minutes to configure.
Privacy and HIPAA note
Lab results are Protected Health Information (PHI). This workflow must run on a self-hosted n8n instance with proper access controls. Do not run it on a shared or cloud-hosted instance without reviewing your HIPAA obligations. For clinical use, consult your compliance team before deploying.
Download
Workflow JSON:
Full workflow collection:
Setup Guide
Step 1: Get your PDF Vector API key
Sign up at pdfvector.com — free plan works for testing. Go to API Keys and generate a key.
Step 2: Create your Google Drive folder
Create a folder called “Lab Results.” Copy the folder ID from the URL.
Step 3: Create your Google Sheet
Headers in Row 1:
Patient | Test Date | Lab | Category | Total Tests | Normal | High | Low | Critical | Overall Status | Physician | Document Link | Processed Date
Step 4: Import the workflow
Download JSON from GitHub → n8n → Import from File.
Step 5: Configure the nodes
Google Drive Trigger:
-
Connect Google Drive account (OAuth2)
-
Paste your folder ID
-
Event: File Created
Download Document:
- Same Google Drive credential
PDF Vector - Extract Results:
-
Add new credential (Bearer Token)
-
Paste your API key
Analyze Results:
-
No config needed — flagging and status calculation run automatically
-
To change the “Multiple Abnormal” threshold, edit the
> 3value in the Code node
Log to Health Tracker:
-
Connect Google Sheets
-
Paste your Sheet ID
Alert - Abnormal Results:
-
Connect Slack
-
Select your health alerts channel
-
Only fires when at least one result is abnormal
Step 6: Test it
Drop any lab result PDF into your Drive folder. Check Slack and your Sheet after about 20 seconds.
Accuracy
Tested on lab reports from major US labs (Quest Diagnostics, LabCorp) and hospital system PDFs.
-
Patient name, test date, lab name: ~97% on standard lab report formats
-
Test names and values: ~95% on digital lab PDFs with clear table formatting
-
Reference ranges: ~93% — extracts correctly when printed as a range (70-99) or separate low/high columns
-
Status flags: ~91% — reliable when the lab explicitly marks results as H/L/Critical
-
Units: ~94%
Scanned or photographed lab reports: accuracy drops to ~75-80%. Digital PDFs direct from lab portals work best.
Cost
Each lab result PDF uses 3-4 PDF Vector credits. Free tier of 100 credits handles roughly 25-30 documents per month.
Customizing it
Track trends over time:
Build a second sheet tab with one row per individual test result (not per document). Over multiple lab visits, you can chart how specific values like HbA1c or cholesterol trend across dates.
Add critical result escalation:
Before the Slack node, add an IF node that checks criticalCount > 0 and routes to a separate urgent channel or sends an email directly to the physician.
For wellness coaches tracking multiple clients:
Add a Client column using the filename prefix (e.g., “CLIENT1-labresults-march.pdf”) and filter the tracker by client name.
Connect to a health app:
Replace or supplement the Sheets node with an HTTP Request to log results into Apple Health, Google Fit, or a custom health database via API.
Limitations
-
Requires self-hosted n8n — PHI should never pass through a shared cloud instance
-
Status detection relies on the lab explicitly marking values as H/L/Critical — doesn’t calculate status from raw values vs ranges independently
-
Some lab formats use non-standard layouts that may miss individual test rows
-
No longitudinal analysis built in — trend tracking requires a separate workflow
Questions? Drop a comment.