I continuously experienced the same on multiple n8n versions in chrome and Wavebox (chromium).
I switched to accessing n8n exclusively in Safari and have not had one crash since. I would prefer chrome, but happy to have the stability.
Thanks for the idea @Davey
I decided to switch browsers and have been working in Firefox all morning,
The single tab is using 2Gig of memory but has not crashed, in Chrome it would crash at least every 30 minutes.
I will try Brave another day
If anyone has experienced the issue NOT in Chrome, please let us know
Interesting, I use Chrome and Brave depending on the machine and not have seen this still ![]()
Can you share how you have n8n setup and what environment options you have set? I am starting to think there could be something there which is why I have not been able to reproduce this yet.
Hey @Jon
This behaviour isn’t that bad with me but I have had similar issues in Chrome.
Sometimes it just stops working and says out of memory. Not too much data in the workflow at that point, also not even when getting more data just while setting up a node.
Also, the server itself was not working that hard. Never goes above 40% of the RAM.
PC itself has plenty of RAM and not really using a lot of it at the moment it crashes.
Seems to be something in Chrome that is simply being a d*ck. Cannot reproduce it as it randomly happens and not that often. (but when it does, it really sucks because those are the times I forgot to save)
I plan on installing Brave just for n8n development.
Hey @BramKn,
It really bugs me that so many people are hitting this issue with Chrome and Chromium based browsers but I have not seen it.
What env options do you tend to set for your instance?
Hey @Jon
Funny thing is, that I cannot remember it happing on a client’s server. Only on my own.
Even though I set up most of those servers the same way. Can be remembering wrong, also it doesn’t happen to often so its very tricky.
my setup:
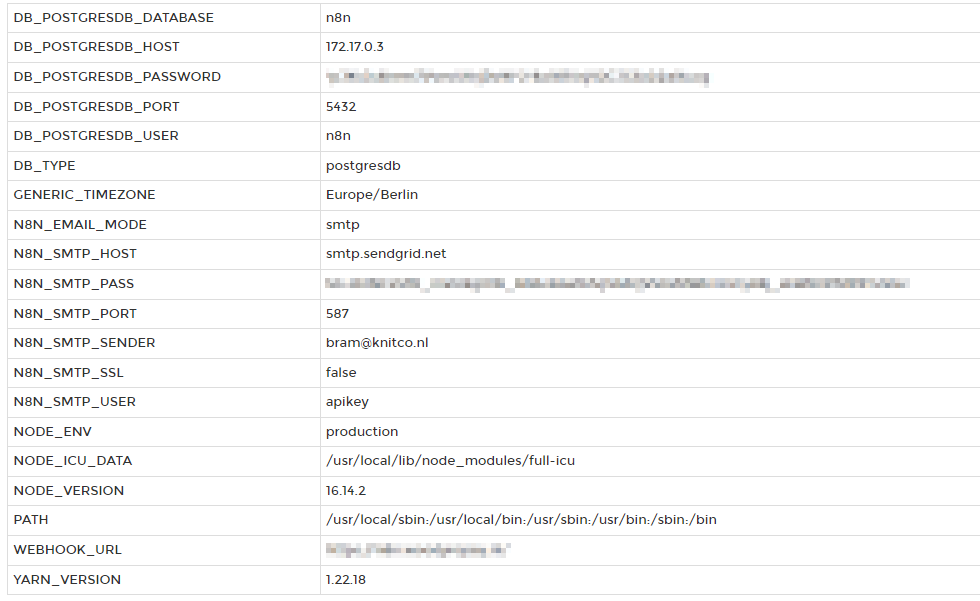
ps. is there an easy way to turn on logging of some sort that I can set and forget and capture the error?
I am perfectly fine sending any logs on this.
@BramKn logging is a tricky one as it is going to be something the front end is doing and I think we log anything for that.
There are some differences there from what I normally use so I will set up an instance that matches that and start using it for all community requests to see what happens.
What is different?
I will try and get a second monitor so I can have the resource usages up to help try and discover a pattern of what triggers it. I’m determined to get this to a point where I can replicate it, then happy to pass on my credentials for further investigation.
2 Likes
@BramKn I have N8N_HIRING_BANNER_ENABLED and N8N_DIAGNOSTICS_ENABLED both set to false along with templates disabled, max payload set to 50 and metrics enabled.
@Jon Those sound like settings that could have some involvement in this issue. ![]()
Hope you can reproduce the issue and that these env variables are the way to fix it.
Morning Everyone,
We managed to reproduce what we think is causing this issue on Friday, If you currently see this a lot refreshing the page will help.
What is happening is when you use the in app menu to go between pages (create new workflow, execution log, Open workflow,…) the canvas is not being fully cleared which over time results in the tab from consuming all of the memory it is allowed to.
This issue is not browser specific and can be reproduced on Chrome, Firefox and Safari.
4 Likes
Refreshing the page does help fix it, however 99% sure it happens when I go directly to the workflow URL and not use the menus
Hey @wgicio,
We will know once we have finished the fix, During our testing refreshing the page or directly loading it would result in the tab memory being correctly cleared.
It is possible that there is a second issue that we have not been able to trigger but this seems to be the main cause.
It seems to me that this problem has gotten much worse with 0.197.1.
I see Aw, Snap very frequently now. And the interface is also generally lacking (for example double clicking a Node is now taking seconds before opening, drag’n’drop values from JSON to fields stutters).
Hey @systemaddict,
That is a bit unexpected but we have not yet fixed the issue we found either as there are multiple parts to it. For now it would be a case of refreshing the page if you notice some slowdown, It should take a while to get there unless you are working on a large workflow (100+ nodes) or dealing with a few thousand records.
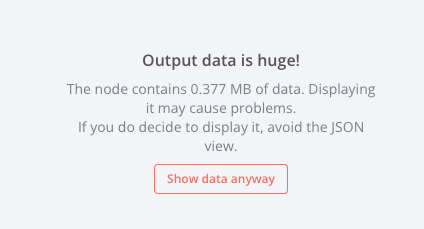
Update: Just tried to run it without pinning and that seems to solve the problems. It’s getting slow again after the first run though (it’s less than 0.5 MB total of data in the entire flow and only 10 nodes).
Not sure if it is related but I use “Pin data” a lot lot (it is a fantastic feature!) and often I’ve got quite big JSON documents in there (but I’m not showing them). Example:
Hey @systemaddict,
The pinned data is still going to add to the memory usage as it is still there so it could be that the pinned data is related. Sadly though until we have fixed what we know is causing part of the issue it will be tricky to test it for pinned data as well so it would be a case of tackling one issue at a time.
2 Likes
Just and update, After going on a break for a while i came back and updated n8n to the latest version (Version 0.208.1) and noticed the old function nodes have been replaced with the new code node.
Started a fresh workflow and started to recreate the workflow with the new code node and the crash issue still happens. so it may not had been the old function nodes causing it
Have not had any issues recently ![]() I think the issue might be resolved.
I think the issue might be resolved. ![]()
1 Like