Hi, I was asked to include a bar chart in addition to the table next to it. Is it possible to generate such a chart from the same data as in the table? The data will be downloaded from my database, I have the tables but I can’t find anything for the chart. Can anyone help me?
It looks like your topic is missing some important information. Could you provide the following if applicable.
- n8n version:
- Database (default: SQLite):
- n8n EXECUTIONS_PROCESS setting (default: own, main):
- Running n8n via (Docker, npm, n8n cloud, desktop app):
- Operating system:
Hey @Voleniusz,
Welcome to the community ![]()
It would be great if you could include some more information but if you are just trying to create a chart you could try the Quickchart node we have to see if that does what you need it to.
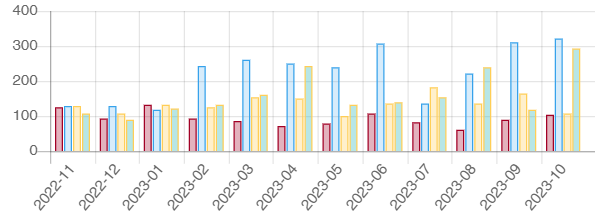
I found this tool, but I can’t play anything on it. The effect is shown in the picture.
Hey @Voleniusz,
Sadly to provide any more help I will need more information, Do you have sample data or a workflow you can share that might help?
Yes, I can provide the data I get from my database in json format.
[
{
“Data”: “2022-11”,
“123”: “126”,
“ABC”: “128”,
“ASD”: “129”,
“QWE”: “109”
},
{
“Data”: “2022-12”,
“123”: “94”,
“ABC”: “129”,
“ASD”: “107”,
“QWE”: “91”
},
{
“Data”: “2023-01”,
“123”: “132”,
“ABC”: “117”,
“ASD”: “132”,
“QWE”: “123”
},
{
“Data”: “2023-02”,
“123”: “94”,
“ABC”: “245”,
“ASD”: “127”,
“QWE”: “131”
},
{
“Data”: “2023-03”,
“123”: “85”,
“ABC”: “260”,
“ASD”: “153”,
“QWE”: “163”
},
{
“Data”: “2023-04”,
“123”: “72”,
“ABC”: “249”,
“ASD”: “152”,
“QWE”: “243”
},
{
“Data”: “2023-05”,
“123”: “79”,
“ABC”: “238”,
“ASD”: “99”,
“QWE”: “132”
},
{
“Data”: “2023-06”,
“123”: “109”,
“ABC”: “308”,
“ASD”: “138”,
“QWE”: “139”
},
{
“Data”: “2023-07”,
“123”: “84”,
“ABC”: “136”,
“ASD”: “181”,
“QWE”: “155”
},
{
“Data”: “2023-08”,
“123”: “60”,
“ABC”: “221”,
“ASD”: “137”,
“QWE”: “239”
},
{
“Data”: “2023-09”,
“123”: “89”,
“ABC”: “310”,
“ASD”: “164”,
“QWE”: “119”
},
{
“Data”: “2023-10”,
“123”: “104”,
“ABC”: “320”,
“ASD”: “108”,
“QWE”: “294”
}
]
What are you trying to do with that data? What are you expecting the end result to be?
the end result is the same as in the picture above. Is it possible to make this type of n8n names?
Hey @Voleniusz,
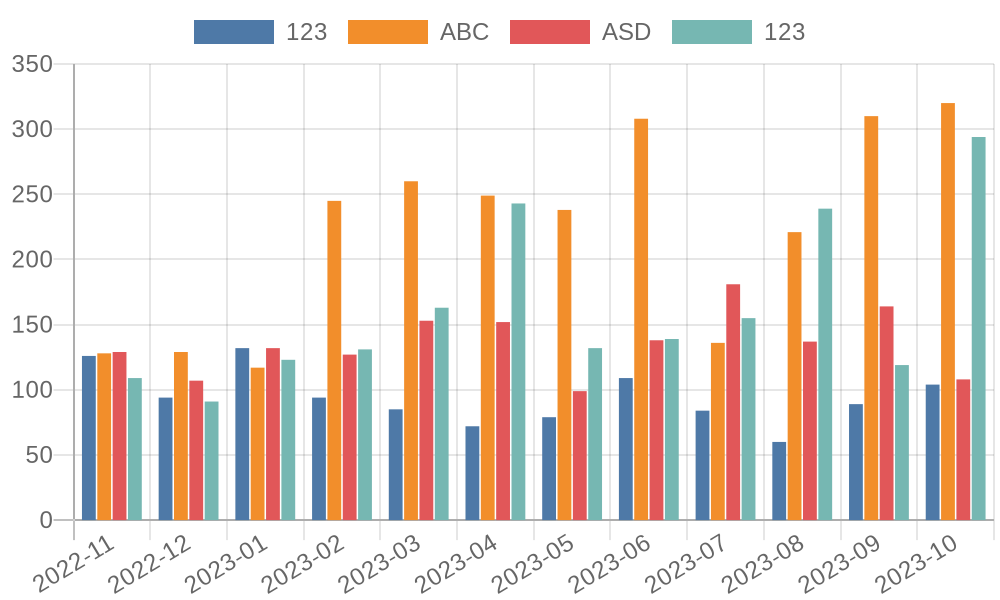
It should be possible to create something like that although to be honest having played with the Quickchart node I am not sure how it actually works so I think I need to spend some time with it to work it out, For now you could do it manually using the Quickchart API. The workflow at the bottom will email the image below which looks close to what you are after.
Damn it works. I get what I wanted thanks to your help. However, is it possible for me to send an e-mail with the table and this image next to it? Can you help me further on this matter?
Hey @Voleniusz,
The table itself might be tricky but it looks like the HTML node has an option to convert to html table which might do the job.
overall the problem is this chart. Because when I send the table itself, I have it nicely in my e-mail. But I don’t know how to add this chart next to it. Will you help?
1 Like
I am battling with the quickchart node too - there seems to be very little info on it. I’m trying to fathom it out using the quickchart examples but not winning.
To go a different route - maybe it would be better to create the full quickchart API url call … any pointers re how to build a URL?
Well, you know, I already have a chart.
I also have the table I am looking for. The problem for me is how to combine these two things so that they are sent in one e-mail.
Hye @emeyedeejay,
Welcome to the community ![]()
The example workflow above uses the quickchat api so would work as a good starting point.