A few weeks ago, I calculated which n8n creators had the most views across all workflows and shared a simple rating. This fun project was created to celebrate the impressive milestone of 1000 workflow templates.
Now, the fully-interactive leaderboard is live!
There are 2 main views available:
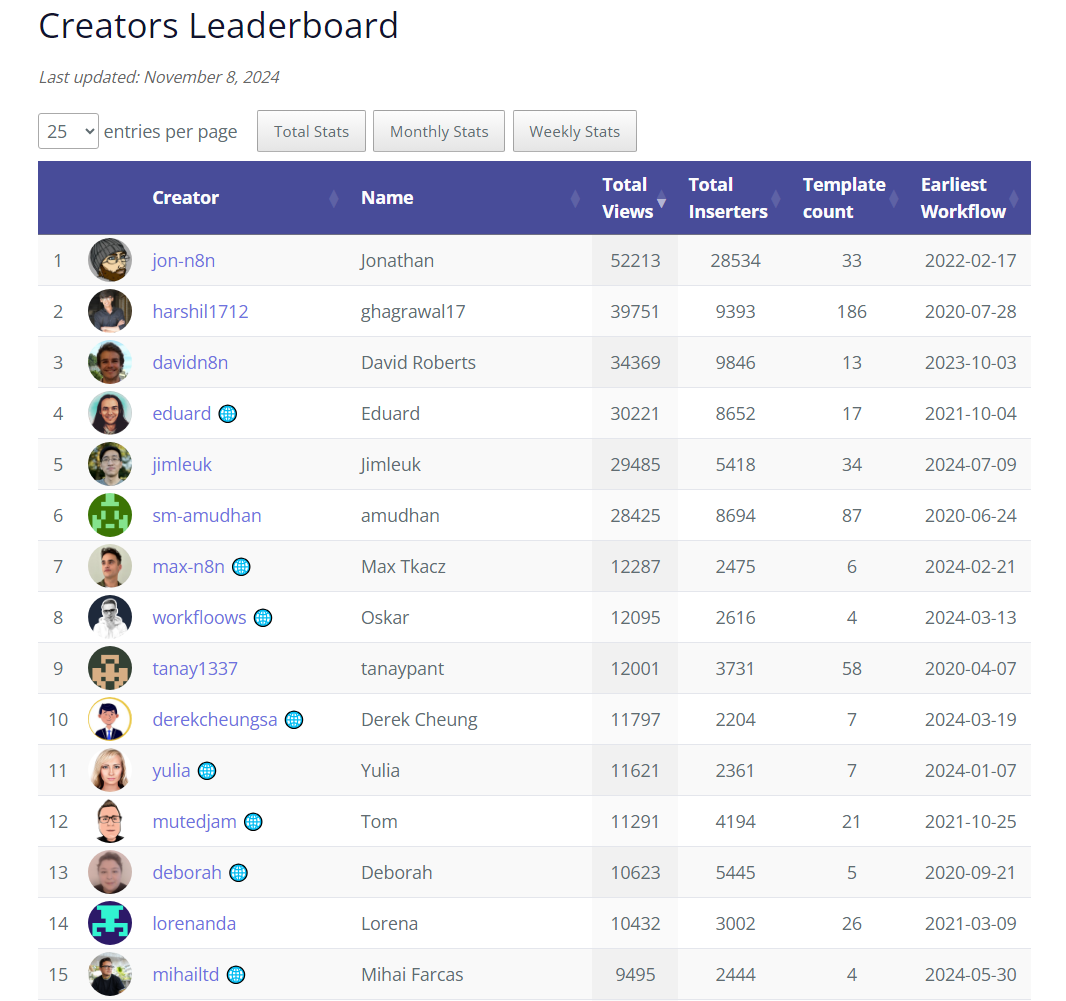
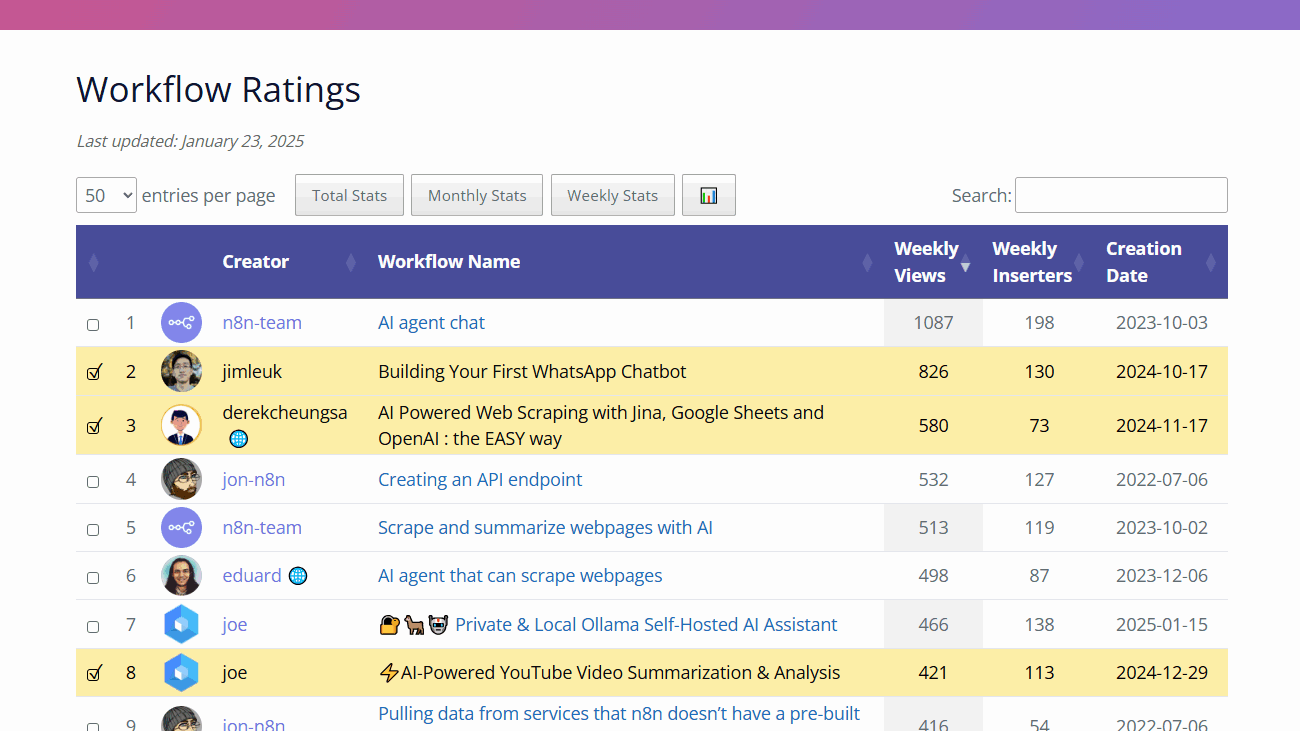
1. Creators Leaderboard
A list of all community authors with their cumulative stats.
You can sort by number of workflows, creator names, or view counts. Switch between total counts, current month, and weekly views.
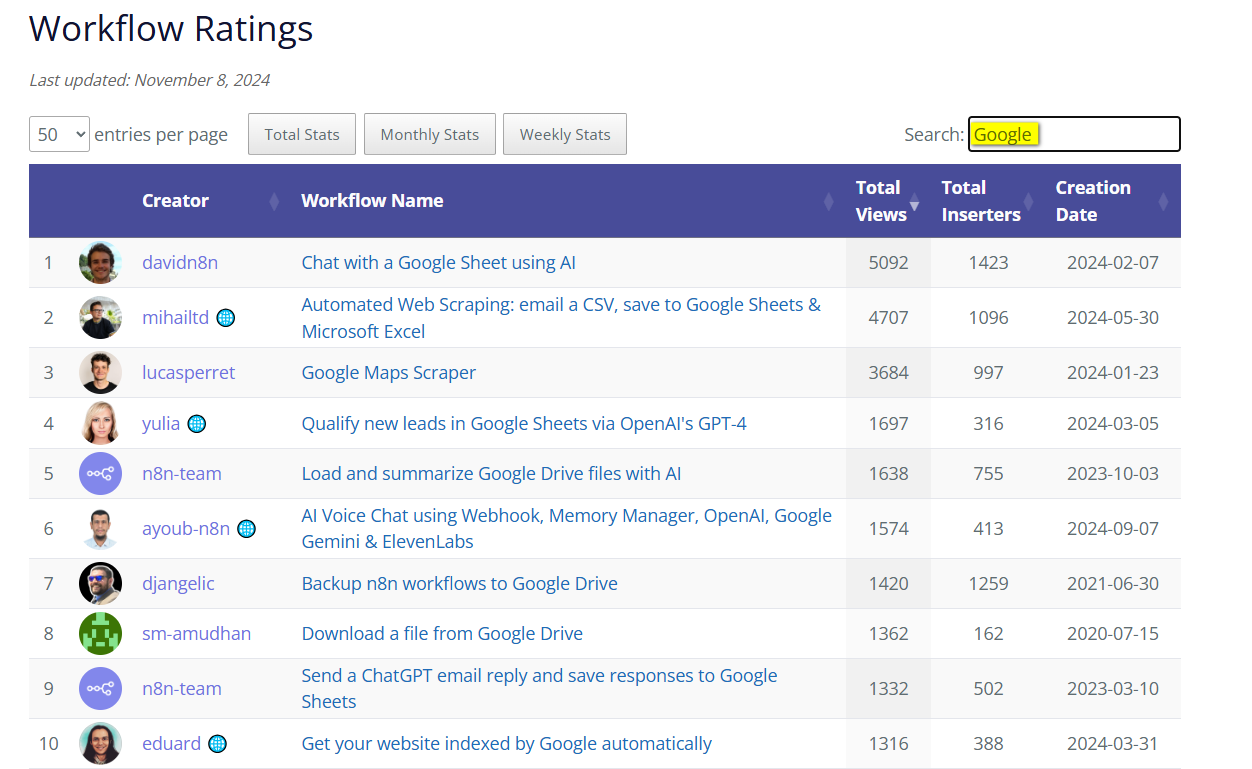
This table displays all workflow templates with their creation date, unique views, and unique inserts. You can switch between total, monthly, and weekly counts.
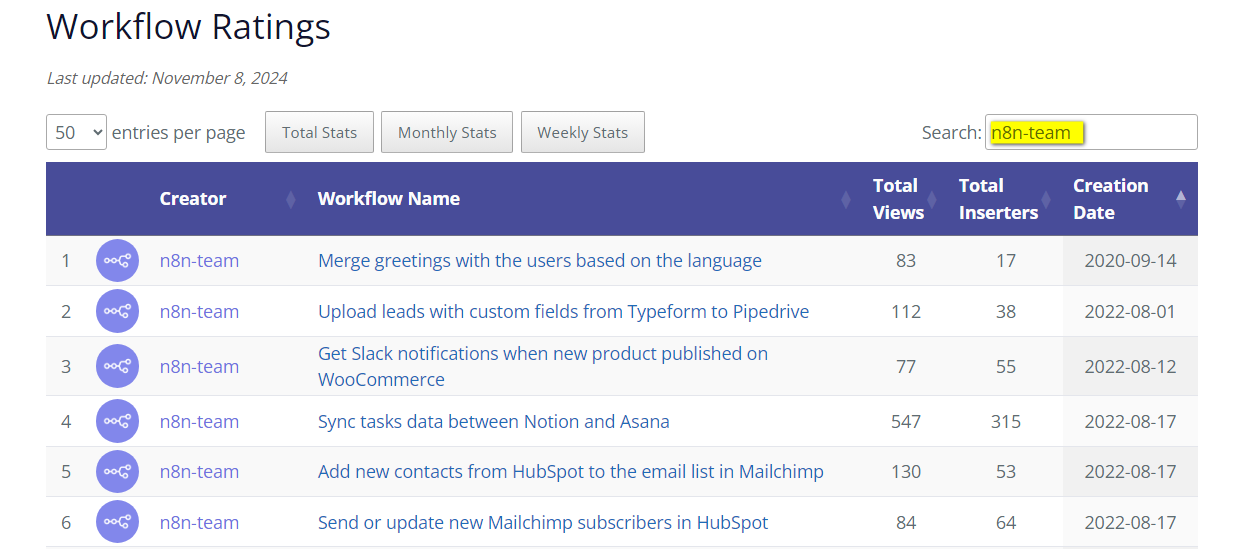
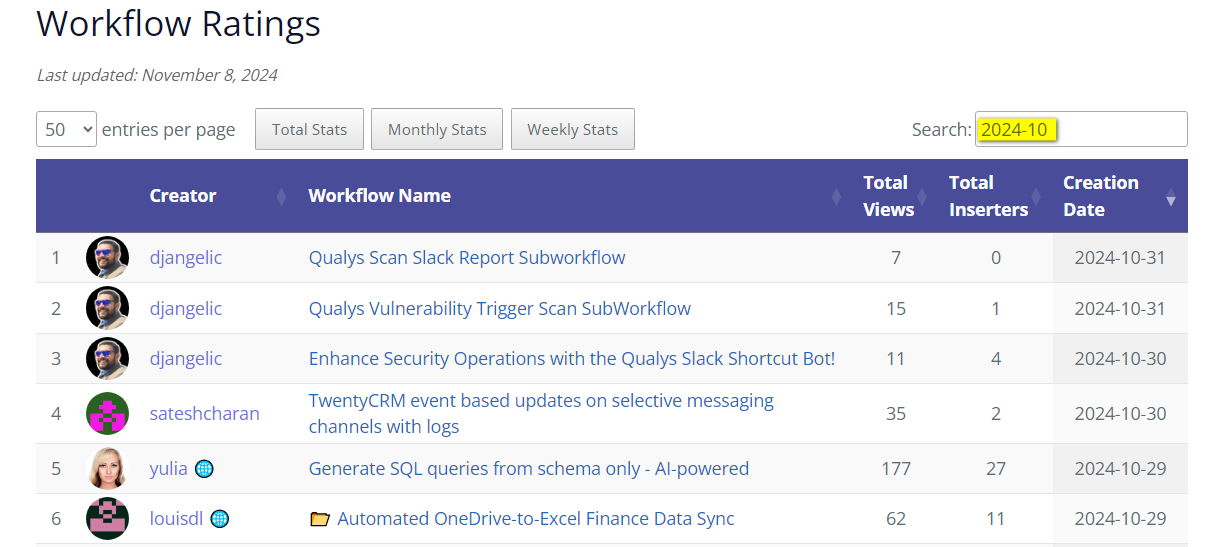
The search field enables quick keyword filtering across workflow titles, creator names, and creation dates. Here’s how it works:
Feel free to explore the best workflows and most reputable creators!
If you have any technical questions or ideas, please raise an issue or create a pull request on the project GitHub repo.
For any possible collaborations or business inquiries, please reach out to Yulia on LinkedIn.
Update:
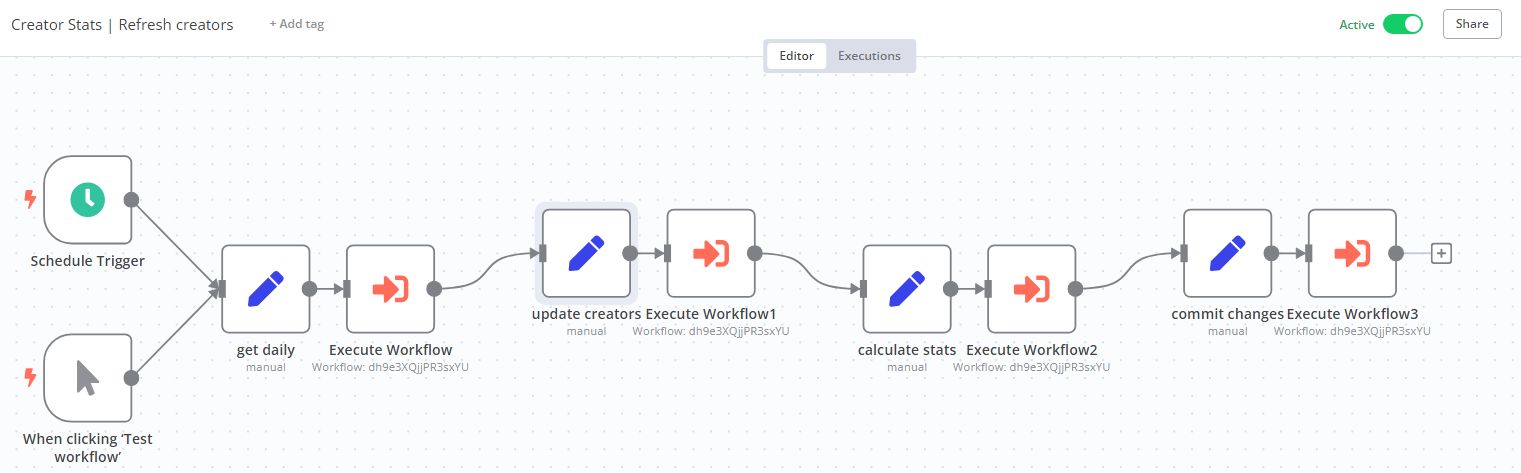
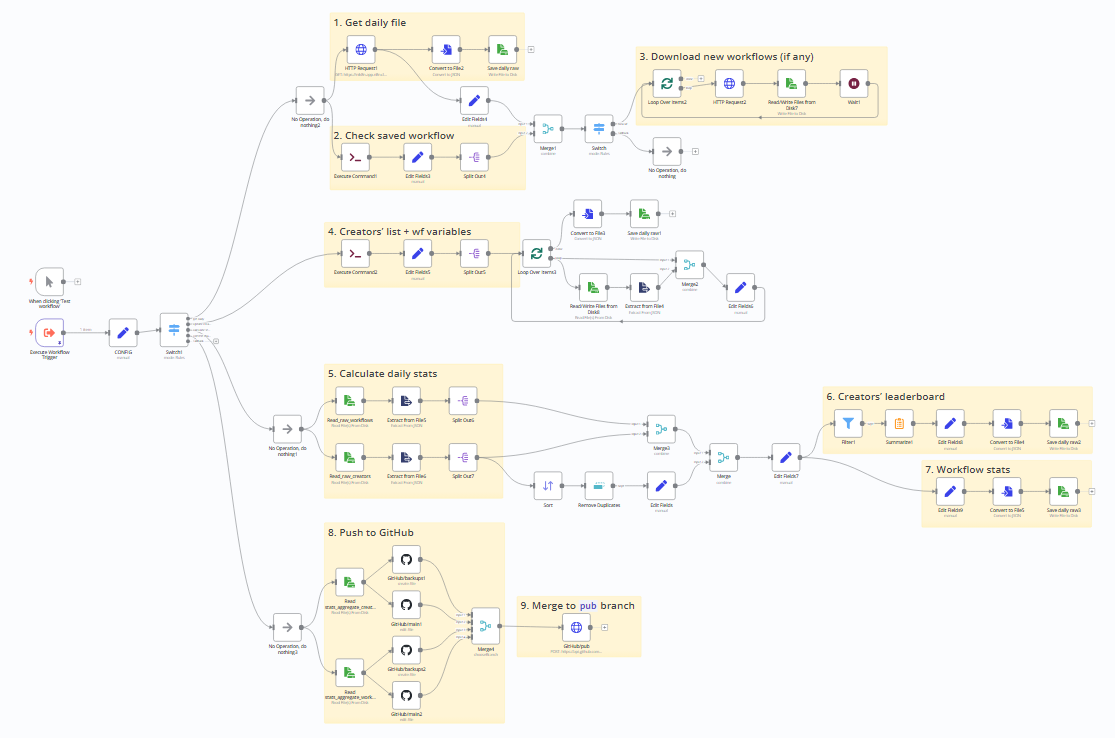
The project is, of course, automatically updated via n8n. Here’s a sneak peek at the workflows that fetch new data, update statistics and push requests to GitHub:
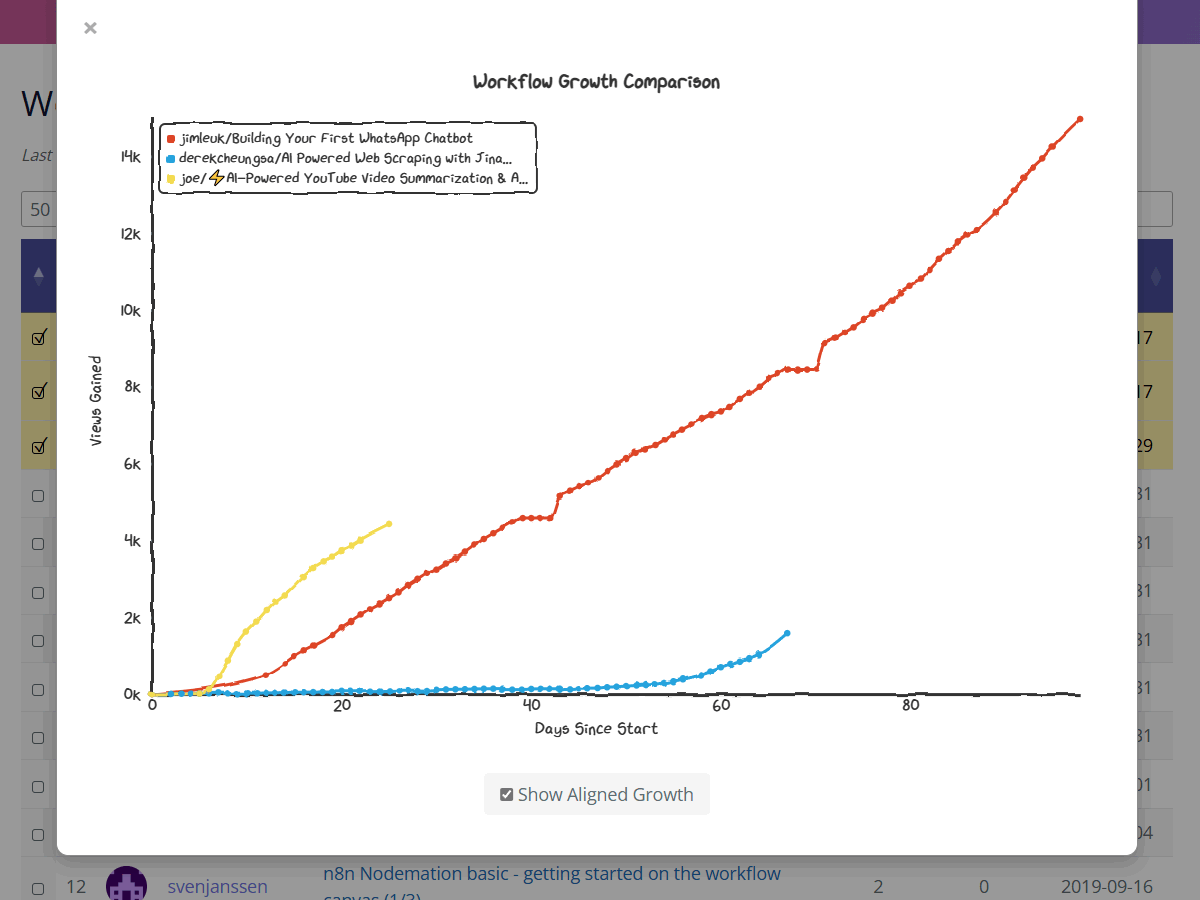
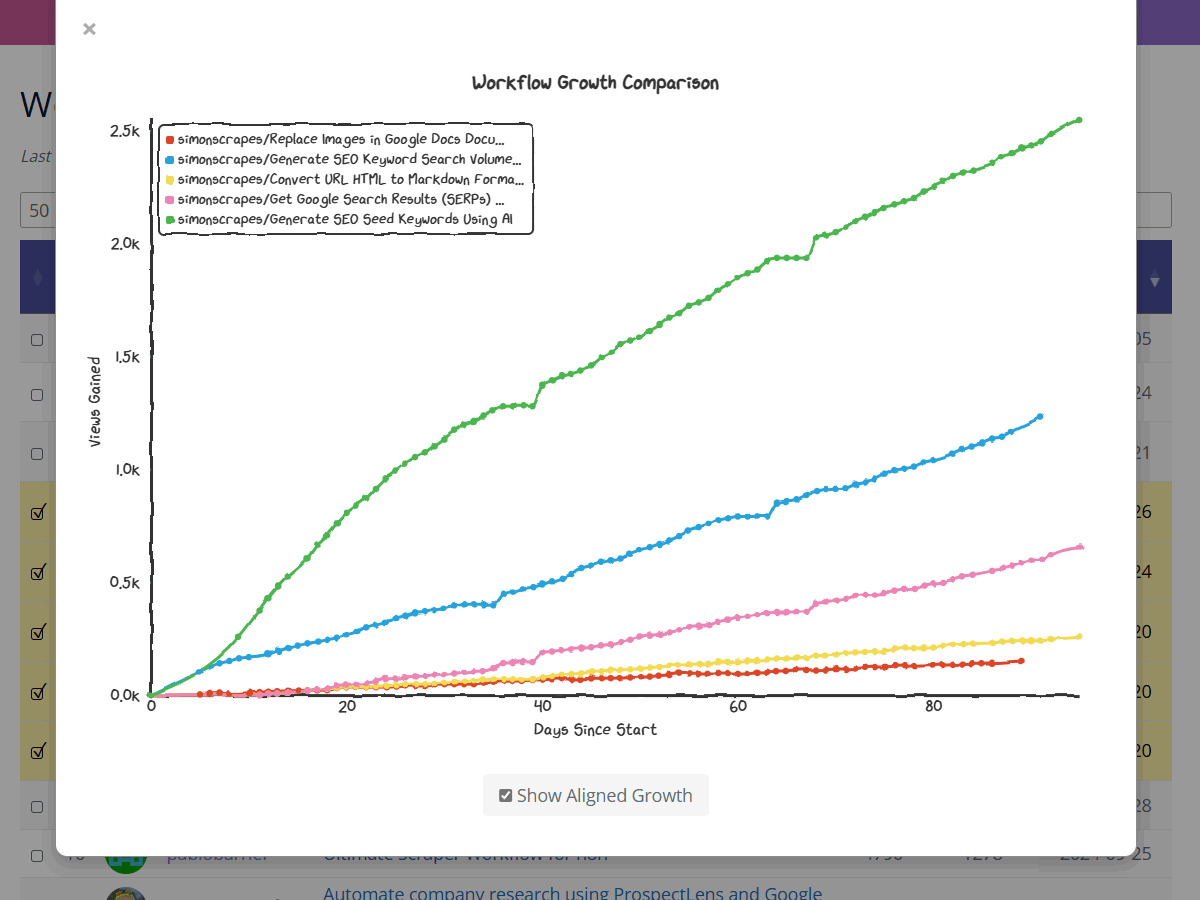
View total views over calendar time or aligned by days since publication (via toggle)
Track both your own workflows if you’re a creator
Discover growth patterns of other community workflows
Check out some interesting patterns:
Some workflows show steady linear growth
Others experience sudden popularity spikes
AI-related workflows tend to gain traction quickly
Older workflows often maintain consistent view rates
Note: Stats for very old workflows might show some gaps in historical data. For the best comparison experience, try focusing on more recent workflows - thanks to the community, there are plenty of great examples to choose from!
To try it yourself:
Select workflows you want to compare using checkboxes in the first column
You can select workflows from different pages - they’ll stay selected
Use the checkbox column filter to quickly see all your selected workflows together
Click the chart icon to view the comparison
Use “Show Aligned Growth” toggle to compare workflows on the same timeline