Describe the problem/error/question
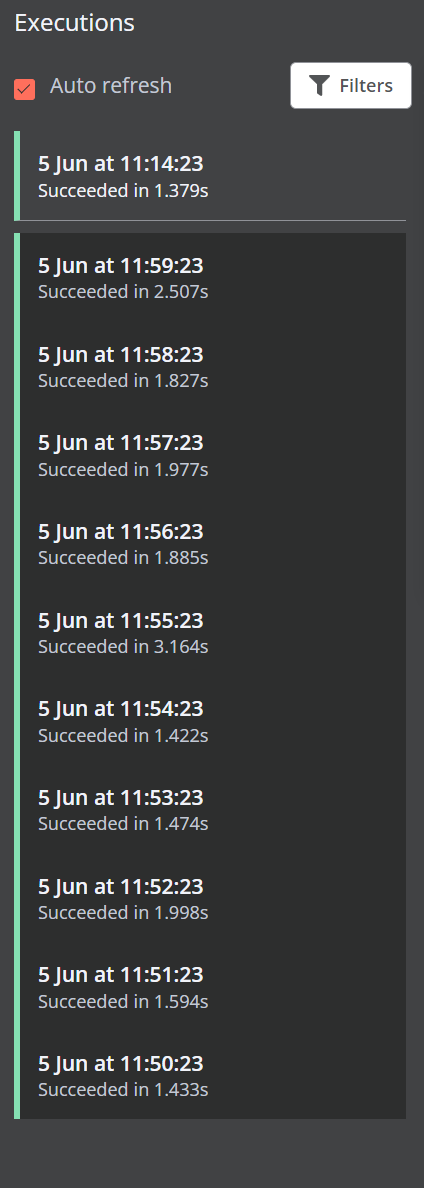
If my workflow contains a lot of executions, I can’t scroll down to see more executions. It is only possible via the global All Executions menu. And if I choose some past executions, it will be loaded on top of the list. Is that how it should be?
Before that there was an option to scroll down and see more executions related to particular workflow.
However, the date filter could display the executions for the desired time, but there are no indicators saying that it has more executions than it is currently displaying. That’s very confusing.
Some examples below.
There are more of them, but it’s not clear that the list is truncated:
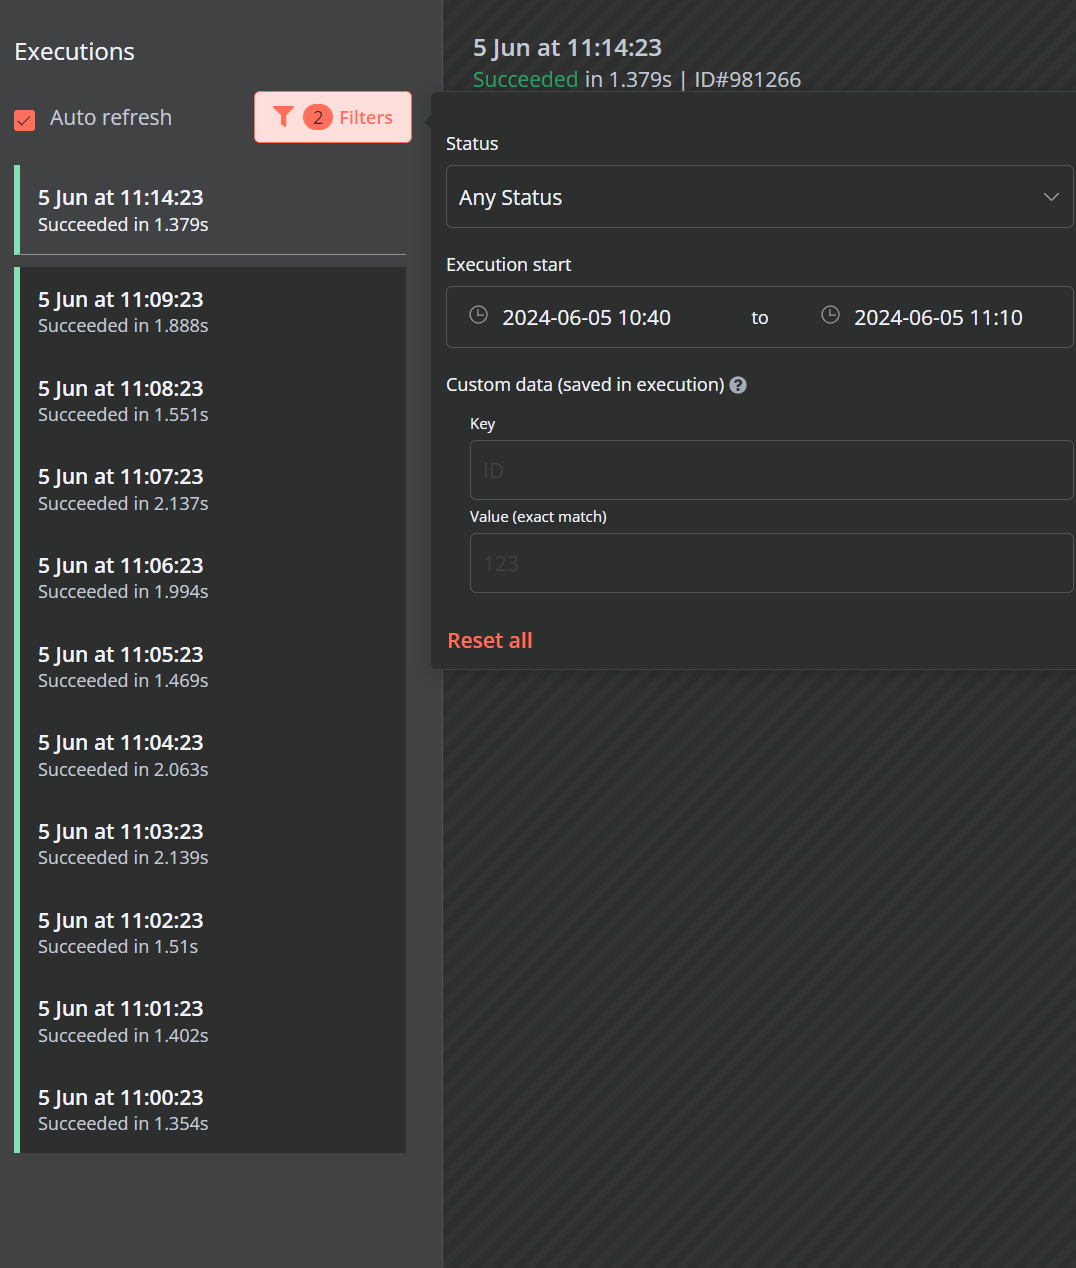
I’ve set the filter to display the executions from 10:40 till 11:10, but it displays only the ones from 11:00 till 11:10 so it may seem that there are no more executions before that.
To answer on the question why don’t I use the All Executions menu: It’s not convenient to look for one particular execution from that menu, if I need to find one for the given time range. E.g. I know that there was an issue with the automation somewhere yesterday between 10:30 and 11:00. My workflow being executed for every minute, so I have 30 executions I need to look in. Keeping switching between tabs is not very convenient as I need to see how the workflow has worked.
Information on your n8n setup
- n8n version: 1.39.1, 1.41.1
- Database (default: SQLite): postgres
- n8n EXECUTIONS_PROCESS setting (default: own, main):
- Running n8n via (Docker, npm, n8n cloud, desktop app): docker
- Operating system: docker