As a data team member, I take time everyday to check if my workflows executions triggered properly and it is honestly just not very practical when you have a lot of them.
My options are:
Go to each workflows and look at its history (when you have 30+ to look everyday that is annoying)
Look at the global history execution (when you have some that executes daily mixed with some that executes weekly or monthly, you have to scroll very far to look for those which is also annoying)
I just wanted to know if there was some improvments on the “monitoring UI” planned at some point down the line?
Maybe something similar to the airflow dashboard which I think is amazing to get all the information in a few seconds. Or something else that could answer that need.
PS: I also use error workflows to send alerts, but it does not replace a monitoring dashboard to check last execution times etc…
I am unsure if the n8n team is working on it. I don’t think they are.
However I also need it and have seen a huge need in the community. So at this moment I am developing a management UI for n8n.
The MVP will not contain executions data yet, but it should be added very fast after the release.
I will not make it available for free, like some of the community dashboards. But I do want to make sure it accessible for everyone not just enterprise.
feel free to send me a PM with your email so I can notify you when it is released.
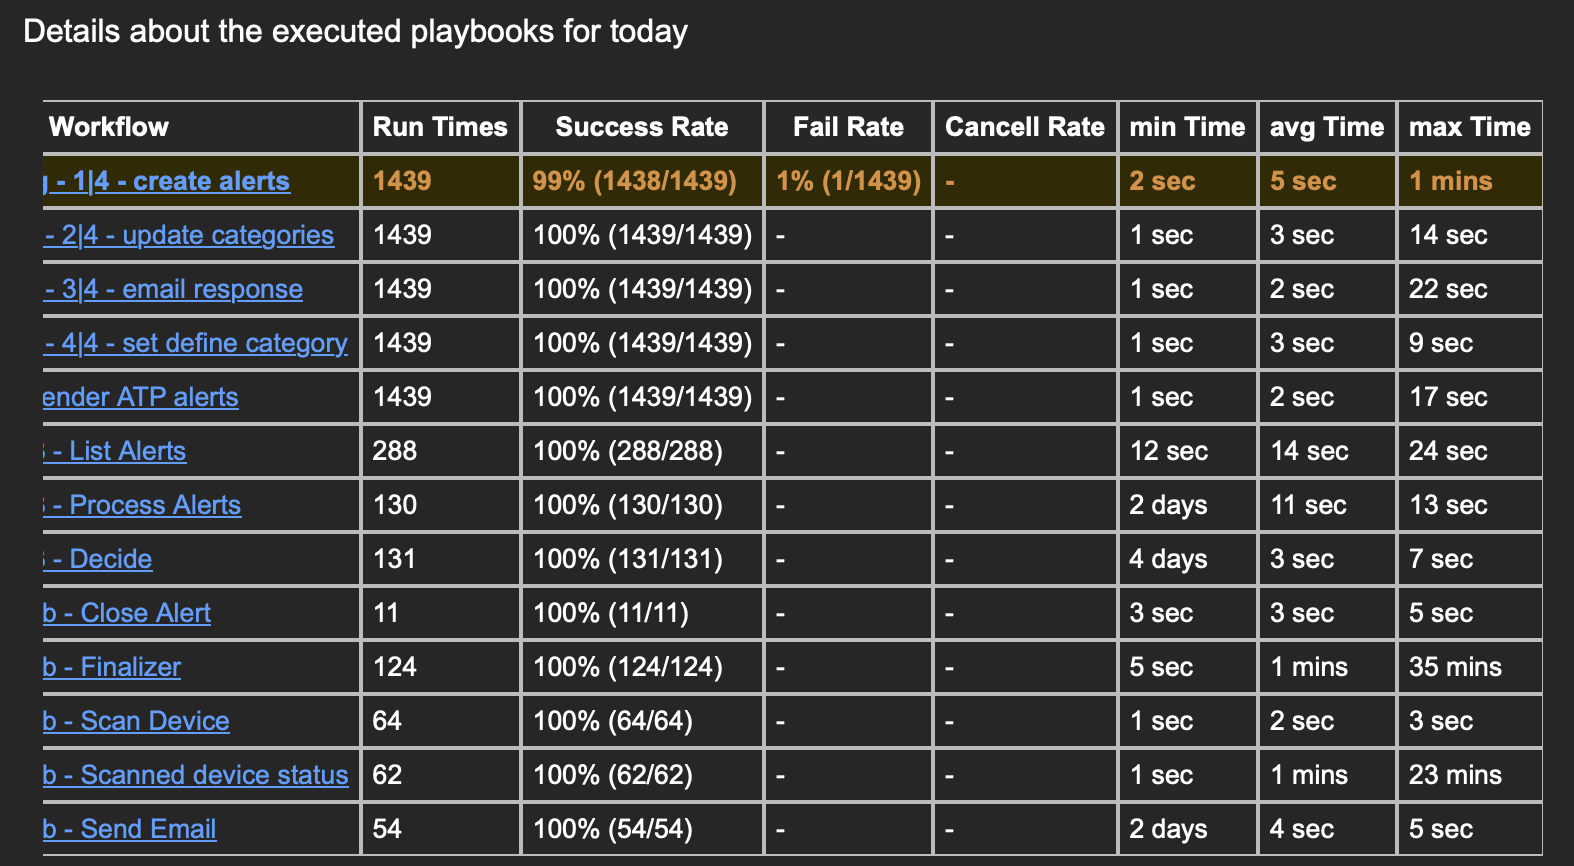
I’ve set some email reports which are populated based on the executions data from the DB (I have daily and weekly reports). The workflows are added automatically if the workflow has a special tag.
I created a grafana dashboard to check executions and specially to monitor failed executions to be able to debug quickly without thé need to check manually all workflows.
I have a around 200 workflows with very few error now, and errors that I have are generally http call that don’t work because of the remote api that is temporary inaccessible.