Generating a data plot, what workflow and nodes should I choose?

I’m figuring out the way n8n sends (by Send Email or any other node) a plot generated from data coming, in my case, from Execute Command on either table o JSON format.

What’s the reccomendation to generate and later send such a plot, as I don’t find operations on spreadsheets nodes for that (only append, delete, etc), neither can find a “Graphics” node that accepts data and generate the plot by itself.

Sorry there is currently no node or functionality to do that. Guess your best bet is to look if there is some kind of external API to which you can send the data and which then returns the plot as an image.

@ejcb I have used this service to add charts to emails. It’s always free as long as you do not mind having the watermark.

1 Like

Thank you both. I’ll give image-charts a try, @RicardoE105

Would Plotly for javascript be a (on-premise) good alternative? In that case, as I’m not a javascript programmer I would appreciate orientations (or kind of how-tos) on using plotly via “Function” node

@ejcb What are you gonna do with the plot once is done? Send it through email? If so, can I see an example of the email you want to send and the incoming data?

Yes @RicardoE105 , I’ll send the plot through email, as an attachment or however it’s easier.

The data that generates the plot is a space separated values like this (storage status):

SMVDT01 7088603398144 4910193049600
SMVDT02 8771037298688 1227915001856
SMVAH01 288972865536 709875466240
SMVAH02 1023410176 997824921600
SMVAH03 988865888256 9982443520
SMVAH04 1139802112 997708529664
SMVAH05 9070182400 109846724608
SMVBP01 287069700096 12772704256
SMVBP02 194047377408 105795026944
SMVMA01 158583488512 1404043264
SMVMB01 220061499392 3780700536832

And the plot to generate (with some added calculations) is a percent stacked barplot:

Perfect @ejcb. Check the example below.

I wonder what SaaS are you using currently to send the emails?

Keep in mind that the node called “processingData” should take the incoming data and map it to the data https://documentation.image-charts.com understands.

Again do not hesitate to ask any further questions.

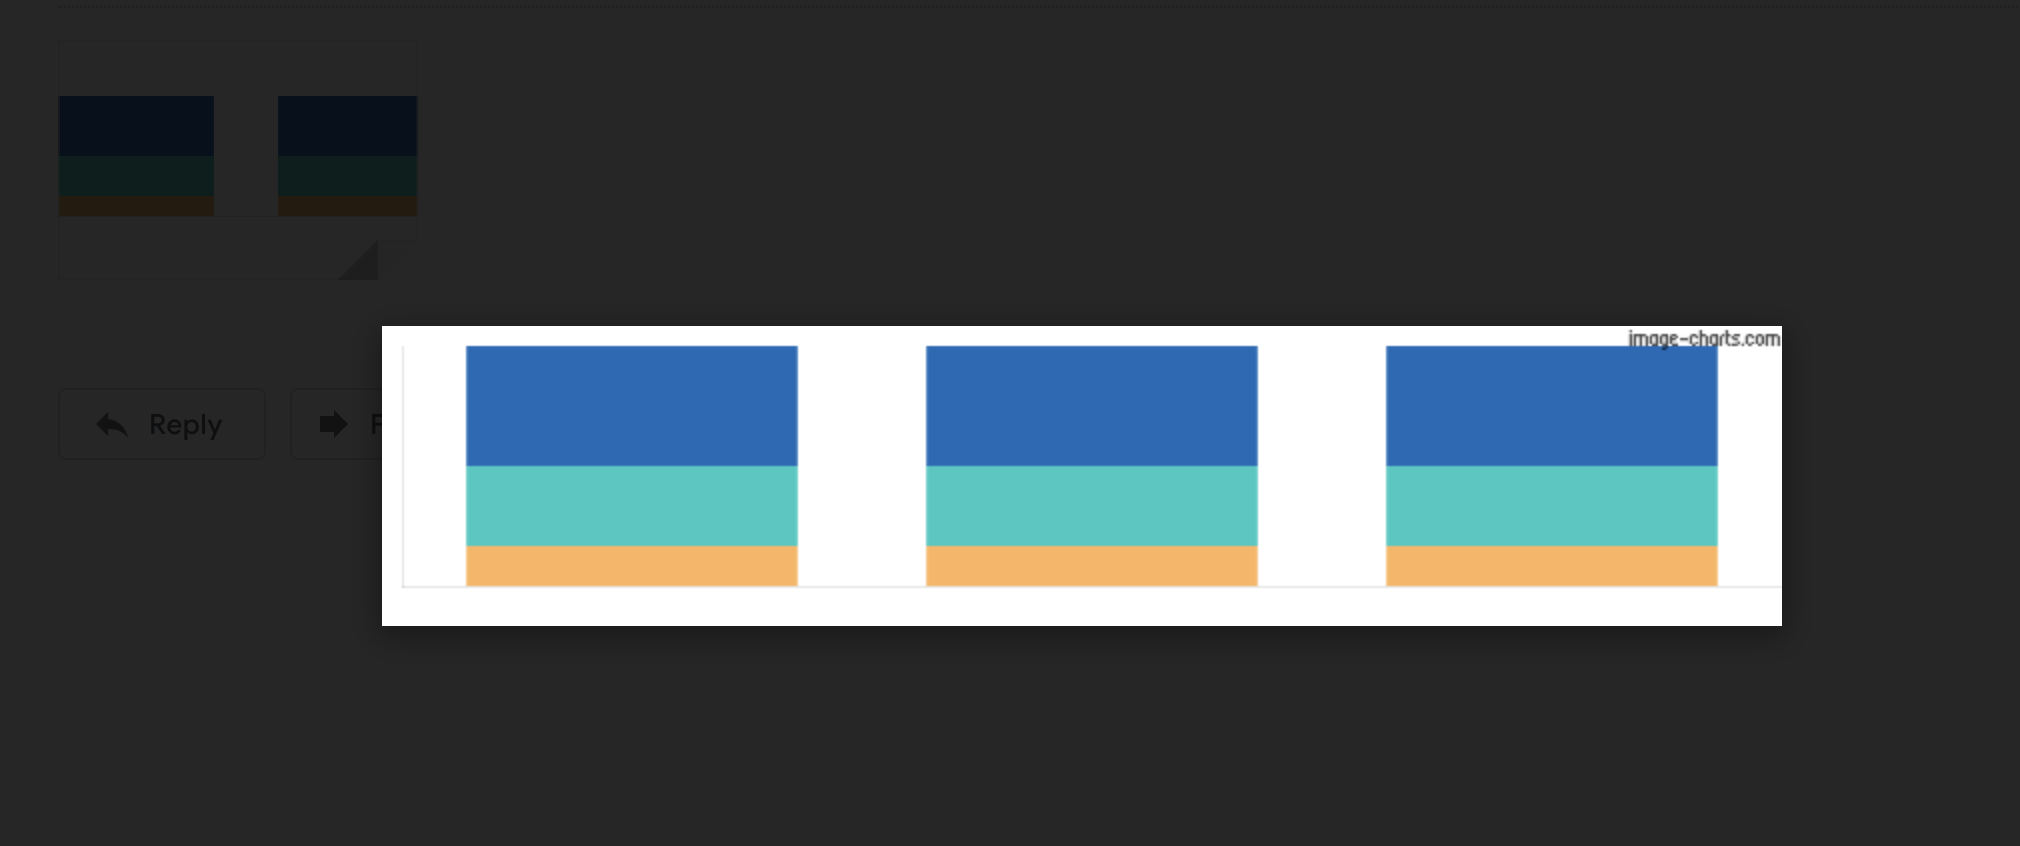
Example of what I got when ran the workflow:


Workflow example:

{
  "nodes": [
    {
      "parameters": {},
      "name": "Start",
      "type": "n8n-nodes-base.start",
      "typeVersion": 1,
      "position": [
        280,
        290
      ]
    },
    {
      "parameters": {
        "url": "={{$node[\"processingData\"].json[\"url\"]}}",
        "responseFormat": "file",
        "options": {}
      },
      "name": "HTTP Request",
      "type": "n8n-nodes-base.httpRequest",
      "typeVersion": 1,
      "position": [
        700,
        290
      ]
    },
    {
      "parameters": {
        "functionCode": "//this function proccess the data and generates the url\n\nreturn [{\n    json: {\n        url: 'https://image-charts.com/chart?chbh=20&chco=fdb45c,27c9c2,1869b7&chd=t:5,5,5|10,10,10|15,15,15&chds=0,120&chm=N,000000,0,0,10|N,000000,0,1,10|N,000000,0,2,10|N,000000,1,0,10|N,000000,1,1,10|N,000000,1,2,10|N,000000,2,0,10|N,000000,2,1,10|N,000000,2,2,10&chma=0,0,10,10&chs=700x150&cht=bvs&chxs=0,000000,0,0,_&chxt=y'\n    }\n}]"
      },
      "name": "processingData",
      "type": "n8n-nodes-base.function",
      "typeVersion": 1,
      "position": [
        510,
        290
      ]
    },
    {
      "parameters": {
        "operation": "sendHtml",
        "fromEmail": "[email protected]",
        "toEmail": "[email protected]",
        "options": {},
        "attachmentsUi": {
          "attachmentsBinary": [
            {
              "property": "data"
            }
          ]
        }
      },
      "name": "Mandrill",
      "type": "n8n-nodes-base.mandrill",
      "typeVersion": 1,
      "position": [
        900,
        290
      ],
      "credentials": {
        "mandrillApi": "asas"
      }
    }
  ],
  "connections": {
    "Start": {
      "main": [
        [
          {
            "node": "processingData",
            "type": "main",
            "index": 0
          }
        ]
      ]
    },
    "HTTP Request": {
      "main": [
        [
          {
            "node": "Mandrill",
            "type": "main",
            "index": 0
          }
        ]
      ]
    },
    "processingData": {
      "main": [
        [
          {
            "node": "HTTP Request",
            "type": "main",
            "index": 0
          }
        ]
      ]
    }
  }
}

@RicardoE105 to get things done I preferred a faster way for me (writing matplotlib python code to produce the plot) but I recognize that’s not the ideal “n8n politics”.

I appreciate your previus answer. This is a better n8n-way to do that, I just couldn’t find the time to check if all features I finally used from matplotlib (not really complex, though) were available on image-charts.com to be worth the learning of its API. Hop I can do it next time.

Thanks you

@ejcb it makes total sense. If you have any other question just let us know.