I would like to understand the internals of n8n and maybe contribute later. But I could not figure out how to set up some breakpoints and run n8n in debug mode with vscode. Thanks in advanced.
This launch.json solved my issue.
{
"version": "0.2.0",
"configurations": [
  {
    "type": "node",
    "request": "launch",
    "name": "Debug n8n",
    "program": "${workspaceFolder}/packages/cli/bin/n8n",
    "cwd": "${workspaceFolder}",
    "outFiles": [
      "${workspaceFolder}/packages/**/dist/*.js"
    ],
    "protocol": "inspector"
  }
]
}
Welcome to the community @software_artisan!
Thanks a lot for sharing your solution with the community!
Hey,
The process is broken for me when launch this debugger. It seems like the execution command is not called or it is blocked by some process. Out of a debugger mode, everything works smoothly though.
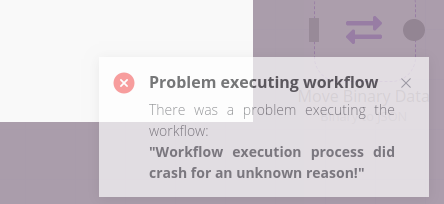
The error caught in the front is as follows: 
Have anyone already faced such a behaviour? Does anyone have any idea of what is going on in this case?
Thanks.
Edit
It seems the debugger tries to attach the subprocesses to the same port as the master one
-The error: Workflow execution process did crash for an unknown reason!
means that the process which was running the workflow crashed. As it did crash n8n can not display any additional information. The main reason why a workflow process would crash is that it runs out of memory. So are you processing big amounts of data that this could be the reason?
It is happening even if I run the start node on an empty workflow
Ah yes you can only run n8n once with the same port. So either you start it “normally” or you start it in debugging. You can not start it “normally” and then again with debugging. They are two totally separate processes.
It is something related to the debugging process,
When I add execution arguments such as --inspect or --harmony to the subprocess in /packages/cli/src/WorkflowRunner.ts L176, the flow doesn’t break but the still the debugger doesn’t stop on the breakpoints inside the subprocess.
const subprocess = fork(pathJoin(__dirname, 'WorkflowRunnerProcess.js'), [], {execArgv: ['--inspect']});
or
const subprocess = fork(pathJoin(__dirname, 'WorkflowRunnerProcess.js'), [], {execArgv: ['--harmony']});
In this case it is probably easier to not start the workflow in a sub-process and instead run it in the main process by setting the environment variable:
export EXECUTIONS_PROCESS=main
Thanks a lot for the tip, adding it to the launch.json file made it work ![]()
{
    // Use IntelliSense to learn about possible attributes.
    // Hover to view descriptions of existing attributes.
    // For more information, visit: https://go.microsoft.com/fwlink/?linkid=830387
    "version": "0.2.0",
    "configurations": [
			{
				"type": "node",
				"request": "launch",
				"name": "Debug n8n",
				"runtimeExecutable": "/home/toky/.nvm/versions/node/v12.16.3/bin/node",
				"program": "${workspaceFolder}/packages/cli/bin/n8n",
				"cwd": "${workspaceFolder}",
				"outFiles": [
					"${workspaceFolder}/packages/**/dist/*.js"
				],
				"env": {
				"EXECUTIONS_PROCESS": "main",
				},
				"protocol": "inspector",
			}
    ]
}
Great to hear. Thanks for posting the updated version.
Have fun!
Has anyone figured out how to debug with Chrome, as described here?
The project has several src directories, so I’m not quite sure what to provide for the webRoot value in the file launch.json.
from what i gather with my limited understanding of VSCode config files, this is a setup for N8N on Linux?
the folder structure dose not look the same on my windows machine.
could you please make an example config for windows?
Inspired by this post and other resources I made a reply to my post about how to debug it in VSCode. I may overlap a little bit, but there are new stuff that may be useful, in particular to beginners.
where the launch.json file is placed. Can I copy it directly
How to setup Debug in VS Code
Setup in VS Code
- create a launch.json under .vscode/
- paste configure
{
    "version": "0.2.0",
    "configurations": [
      {
        "type": "node",
        "request": "launch",
        "name": "Debug n8n",
        "program": "${workspaceFolder}/packages/cli/bin/n8n",
        "cwd": "${workspaceFolder}",
        "outFiles": [
          "${workspaceFolder}/packages/**/dist/*.js"
        ],
        "protocol": "inspector"
      }
    ]
    }
- navigate to left bar, click debug icon
- you could click on
Debug n8nto star
- you could click on
User correct node version
The solution below fixed my issue, but you might need more hints with the link above.
- you can set your default nvm as correct version under your terminal:
nvm alias default 14 - add node version in launch.json
{
    "version": "0.2.0",
    "configurations": [
      {
        "type": "node",
        "runtimeVersion": "14",   // <-- added
        "request": "launch",
        "name": "Debug n8n",
        "program": "${workspaceFolder}/packages/cli/bin/n8n",
        "cwd": "${workspaceFolder}",
        "outFiles": [
          "${workspaceFolder}/packages/**/dist/*.js"
        ],
        "protocol": "inspector"
      }
    ]
    }
set a breakpoint
you can set up a breakpoint anywhere by adding this line:
debugger;
