Issue - Rebeated crashes after upgrade - FATAL ERROR: Reached heap limit Allocation failed - JavaScript heap out of memory

After upgrade to latest, repeated crashes with the error

FATAL ERROR: Reached heap limit Allocation failed - JavaScript heap out of memory

* 11/04/2022 2:00:28 AM

<--- Last few GCs --->

* 11/04/2022 2:00:28 AM

* 11/04/2022 2:00:28 AM

[8:0x7fe1399dc3e0] 101707 ms: Mark-sweep 1851.5 (1896.1) -> 1851.4 (1896.1) MB, 47.9 / 0.2 ms (+ 0.2 ms in 8 steps since start of marking, biggest step 0.1 ms, walltime since start of marking 792 ms) (average mu = 0.993, current mu = 0.956) allocation [8:0x7fe1399dc3e0] 102533 ms: Mark-sweep 2117.0 (2159.2) -> 2115.1 (2152.5) MB, 264.1 / 0.1 ms (average mu = 0.969, current mu = 0.680) allocation failure GC in old space requested

* 11/04/2022 2:00:28 AM

* 11/04/2022 2:00:28 AM

* 11/04/2022 2:00:28 AM

<--- JS stacktrace --->

* 11/04/2022 2:00:28 AM

Something changed on how memory is being changed?

Synology DSM Intel (Docker host)

Hey @ansred,

What version did you upgrade from and can you confirm the version you are on now? If you go back to that version does the workflow still run as expected?

Hi @Jon

Current version is:
0.201.0

Upgraded from:
0.199.0

I think I found the first place that causing that memory leak issue.

When the docker container is in idle (not running any workflows) it consumes ~130 MB

The moment I click on the left tab (Executions) it spikes to > 3 GB!

Example from the docker log #

11/04/2022 2:08:42 AM
http://localhost:5678/
11/04/2022 5:11:32 AM
query is slow: SELECT "ExecutionEntity"."id" AS "ExecutionEntity_id", "ExecutionEntity"."data" AS "ExecutionEntity_data", "ExecutionEntity"."finished" AS "ExecutionEntity_finished", "ExecutionEntity"."mode" AS "ExecutionEntity_mode", "ExecutionEntity"."retryOf" AS "ExecutionEntity_retryOf", "ExecutionEntity"."retrySuccessId" AS "ExecutionEntity_retrySuccessId", "ExecutionEntity"."startedAt" AS "ExecutionEntity_startedAt", "ExecutionEntity"."stoppedAt" AS "ExecutionEntity_stoppedAt", "ExecutionEntity"."workflowData" AS "ExecutionEntity_workflowData", "ExecutionEntity"."workflowId" AS "ExecutionEntity_workflowId", "ExecutionEntity"."waitTill" AS "ExecutionEntity_waitTill" FROM "execution_entity" "ExecutionEntity" WHERE "ExecutionEntity"."workflowId" IN (?, ?, ?, ?, ?, ?, ?, ?, ?, ?, ?, ?, ?, ?, ?, ?, ?, ?, ?, ?, ?, ?, ?, ?, ?, ?, ?, ?, ?, ?, ?, ?, ?, ?, ?, ?, ?, ?, ?, ?, ?, ?, ?, ?, ?, ?, ?, ?, ?, ?, ?, ?, ?, ?, ?, ?, ?, ?) AND 1=1 ORDER BY id DESC LIMIT 10 -- PARAMETERS: [1,2,3,4,5,6,7,8,9,10,11,12,13,14,15,16,17,18,19,20,21,22,23,24,25,26,27,28,29,30,31,32,33,34,35,36,37,38,39,40,41,42,43,44,45,46,47,48,49,50,51,52,53,54,55,56,57,58]
11/04/2022 5:11:32 AM
execution time: 7294
11/04/2022 5:11:33 AM
query is slow: SELECT "SharedWorkflow"."createdAt" AS "SharedWorkflow_createdAt", "SharedWorkflow"."updatedAt" AS "SharedWorkflow_updatedAt", "SharedWorkflow"."roleId" AS "SharedWorkflow_roleId", "SharedWorkflow"."userId" AS "SharedWorkflow_userId", "SharedWorkflow"."workflowId" AS "SharedWorkflow_workflowId", "SharedWorkflow__workflow"."createdAt" AS "SharedWorkflow__workflow_createdAt", "SharedWorkflow__workflow"."updatedAt" AS "SharedWorkflow__workflow_updatedAt", "SharedWorkflow__workflow"."id" AS "SharedWorkflow__workflow_id", "SharedWorkflow__workflow"."name" AS "SharedWorkflow__workflow_name", "SharedWorkflow__workflow"."active" AS "SharedWorkflow__workflow_active", "SharedWorkflow__workflow"."nodes" AS "SharedWorkflow__workflow_nodes", "SharedWorkflow__workflow"."connections" AS "SharedWorkflow__workflow_connections", "SharedWorkflow__workflow"."settings" AS "SharedWorkflow__workflow_settings", "SharedWorkflow__workflow"."staticData" AS "SharedWorkflow__workflow_staticData", "SharedWorkflow__workflow"."pinData" AS "SharedWorkflow__workflow_pinData" FROM "shared_workflow" "SharedWorkflow" LEFT JOIN "workflow_entity" "SharedWorkflow__workflow" ON "SharedWorkflow__workflow"."id"="SharedWorkflow"."workflowId"
11/04/2022 5:11:33 AM
execution time: 1010
11/04/2022 5:12:25 AM
query is slow: SELECT "ExecutionEntity"."id" AS "ExecutionEntity_id", "ExecutionEntity"."data" AS "ExecutionEntity_data", "ExecutionEntity"."finished" AS "ExecutionEntity_finished", "ExecutionEntity"."mode" AS "ExecutionEntity_mode", "ExecutionEntity"."retryOf" AS "ExecutionEntity_retryOf", "ExecutionEntity"."retrySuccessId" AS "ExecutionEntity_retrySuccessId", "ExecutionEntity"."startedAt" AS "ExecutionEntity_startedAt", "ExecutionEntity"."stoppedAt" AS "ExecutionEntity_stoppedAt", "ExecutionEntity"."workflowData" AS "ExecutionEntity_workflowData", "ExecutionEntity"."workflowId" AS "ExecutionEntity_workflowId", "ExecutionEntity"."waitTill" AS "ExecutionEntity_waitTill" FROM "execution_entity" "ExecutionEntity" WHERE "ExecutionEntity"."workflowId" IN (?, ?, ?, ?, ?, ?, ?, ?, ?, ?, ?, ?, ?, ?, ?, ?, ?, ?, ?, ?, ?, ?, ?, ?, ?, ?, ?, ?, ?, ?, ?, ?, ?, ?, ?, ?, ?, ?, ?, ?, ?, ?, ?, ?, ?, ?, ?, ?, ?, ?, ?, ?, ?, ?, ?, ?, ?, ?) AND 1=1 ORDER BY id DESC LIMIT 30 -- PARAMETERS: [1,2,3,4,5,6,7,8,9,10,11,12,13,14,15,16,17,18,19,20,21,22,23,24,25,26,27,28,29,30,31,32,33,34,35,36,37,38,39,40,41,42,43,44,45,46,47,48,49,50,51,52,53,54,55,56,57,58]
11/04/2022 5:12:25 AM
execution time: 47627
11/04/2022 5:12:26 AM
query is slow: SELECT "SharedWorkflow"."createdAt" AS "SharedWorkflow_createdAt", "SharedWorkflow"."updatedAt" AS "SharedWorkflow_updatedAt", "SharedWorkflow"."roleId" AS "SharedWorkflow_roleId", "SharedWorkflow"."userId" AS "SharedWorkflow_userId", "SharedWorkflow"."workflowId" AS "SharedWorkflow_workflowId", "SharedWorkflow__workflow"."createdAt" AS "SharedWorkflow__workflow_createdAt", "SharedWorkflow__workflow"."updatedAt" AS "SharedWorkflow__workflow_updatedAt", "SharedWorkflow__workflow"."id" AS "SharedWorkflow__workflow_id", "SharedWorkflow__workflow"."name" AS "SharedWorkflow__workflow_name", "SharedWorkflow__workflow"."active" AS "SharedWorkflow__workflow_active", "SharedWorkflow__workflow"."nodes" AS "SharedWorkflow__workflow_nodes", "SharedWorkflow__workflow"."connections" AS "SharedWorkflow__workflow_connections", "SharedWorkflow__workflow"."settings" AS "SharedWorkflow__workflow_settings", "SharedWorkflow__workflow"."staticData" AS "SharedWorkflow__workflow_staticData", "SharedWorkflow__workflow"."pinData" AS "SharedWorkflow__workflow_pinData" FROM "shared_workflow" "SharedWorkflow" LEFT JOIN "workflow_entity" "SharedWorkflow__workflow" ON "SharedWorkflow__workflow"."id"="SharedWorkflow"."workflowId"
11/04/2022 5:12:26 AM
execution time: 1515
11/04/2022 5:12:26 AM
query is slow: SELECT "User"."createdAt" AS "User_createdAt", "User"."updatedAt" AS "User_updatedAt", "User"."id" AS "User_id", "User"."email" AS "User_email", "User"."firstName" AS "User_firstName", "User"."lastName" AS "User_lastName", "User"."password" AS "User_password", "User"."resetPasswordToken" AS "User_resetPasswordToken", "User"."resetPasswordTokenExpiration" AS "User_resetPasswordTokenExpiration", "User"."personalizationAnswers" AS "User_personalizationAnswers", "User"."settings" AS "User_settings", "User"."apiKey" AS "User_apiKey", "User"."globalRoleId" AS "User_globalRoleId", "User__globalRole"."createdAt" AS "User__globalRole_createdAt", "User__globalRole"."updatedAt" AS "User__globalRole_updatedAt", "User__globalRole"."id" AS "User__globalRole_id", "User__globalRole"."name" AS "User__globalRole_name", "User__globalRole"."scope" AS "User__globalRole_scope" FROM "user" "User" LEFT JOIN "role" "User__globalRole" ON "User__globalRole"."id"="User"."globalRoleId" WHERE "User"."id" IN (?) -- PARAMETERS: ["ca7028e1-66e6-4b35-82fa-c5916c801882"]
11/04/2022 5:12:26 AM
execution time: 1595
11/04/2022 5:12:26 AM
query is slow: SELECT "User"."createdAt" AS "User_createdAt", "User"."updatedAt" AS "User_updatedAt", "User"."id" AS "User_id", "User"."email" AS "User_email", "User"."firstName" AS "User_firstName", "User"."lastName" AS "User_lastName", "User"."password" AS "User_password", "User"."resetPasswordToken" AS "User_resetPasswordToken", "User"."resetPasswordTokenExpiration" AS "User_resetPasswordTokenExpiration", "User"."personalizationAnswers" AS "User_personalizationAnswers", "User"."settings" AS "User_settings", "User"."apiKey" AS "User_apiKey", "User"."globalRoleId" AS "User_globalRoleId", "User__globalRole"."createdAt" AS "User__globalRole_createdAt", "User__globalRole"."updatedAt" AS "User__globalRole_updatedAt", "User__globalRole"."id" AS "User__globalRole_id", "User__globalRole"."name" AS "User__globalRole_name", "User__globalRole"."scope" AS "User__globalRole_scope" FROM "user" "User" LEFT JOIN "role" "User__globalRole" ON "User__globalRole"."id"="User"."globalRoleId" WHERE "User"."id" IN (?) -- PARAMETERS: ["ca7028e1-66e6-4b35-82fa-c5916c801882"]
11/04/2022 5:12:26 AM
execution time: 1614
11/04/2022 5:12:26 AM
query is slow: SELECT "User"."createdAt" AS "User_createdAt", "User"."updatedAt" AS "User_updatedAt", "User"."id" AS "User_id", "User"."email" AS "User_email", "User"."firstName" AS "User_firstName", "User"."lastName" AS "User_lastName", "User"."password" AS "User_password", "User"."resetPasswordToken" AS "User_resetPasswordToken", "User"."resetPasswordTokenExpiration" AS "User_resetPasswordTokenExpiration", "User"."personalizationAnswers" AS "User_personalizationAnswers", "User"."settings" AS "User_settings", "User"."apiKey" AS "User_apiKey", "User"."globalRoleId" AS "User_globalRoleId", "User__globalRole"."createdAt" AS "User__globalRole_createdAt", "User__globalRole"."updatedAt" AS "User__globalRole_updatedAt", "User__globalRole"."id" AS "User__globalRole_id", "User__globalRole"."name" AS "User__globalRole_name", "User__globalRole"."scope" AS "User__globalRole_scope" FROM "user" "User" LEFT JOIN "role" "User__globalRole" ON "User__globalRole"."id"="User"."globalRoleId" WHERE "User"."id" IN (?) -- PARAMETERS: ["ca7028e1-66e6-4b35-82fa-c5916c801882"]
11/04/2022 5:12:26 AM
execution time: 1621
Hey @ansred,

How many executions do you have stored in the database? Is that when you just click or do you scroll as well?

Hi @Jon

Just the moment I click on the executions and it lists the first 10 rows, and will start spike to 2.5 - 3 GB

I did’t even click on load more/scroll.

I just tested that and it crashed again from that page.

11/04/2022 5:44:23 AM
<--- Last few GCs --->
11/04/2022 5:44:23 AM
[8:0x7f253a6e53e0] 12986700 ms: Mark-sweep 1851.4 (1889.9) -> 1851.4 (1890.1) MB, 48.3 / 0.2 ms  (+ 0.2 ms in 8 steps since start of marking, biggest step 0.1 ms, walltime since start of marking 786 ms) (average mu = 0.998, current mu = 0.954) allocation [8:0x7f253a6e53e0] 12989346 ms: Mark-sweep 2130.5 (2153.2) -> 2115.9 (2154.2) MB, 216.6 / 0.3 ms  (average mu = 0.992, current mu = 0.918) allocation failure scavenge might not succeed
11/04/2022 5:44:23 AM
<--- JS stacktrace --->
11/04/2022 5:44:23 AM
FATAL ERROR: Reached heap limit Allocation failed - JavaScript heap out of memory

Hey @ansred,

How many execution records do you have in the database? On the top left of the execution window there will be something like X/Y.

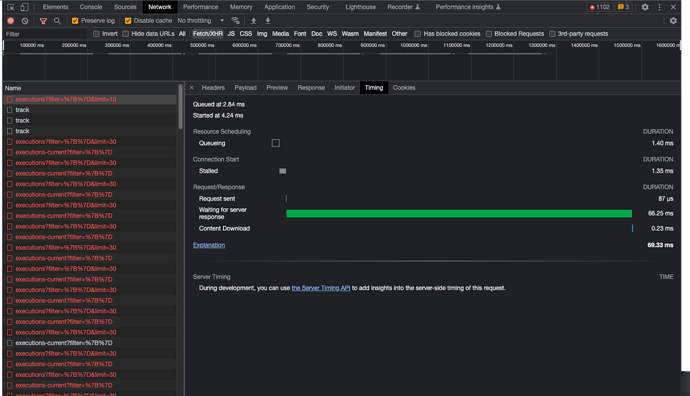
If you pop open the browser console and go to the network tab there will be a call to /rest/executions, What is the size of that?

Hi @Jon

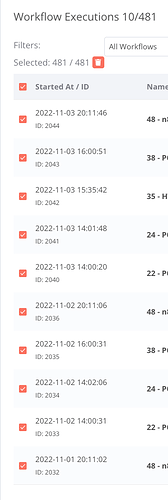
When I click on the checkbox (it shows) 481 records

About the Network tab /rest/executions not sure where is that?

Note: I just downgraded the instance back to # 0.199.0

It’s running faster and way smoother than the latest.

However, something not right on how the list of executions is being handled, as the larger is gets, the way more memory it eats!

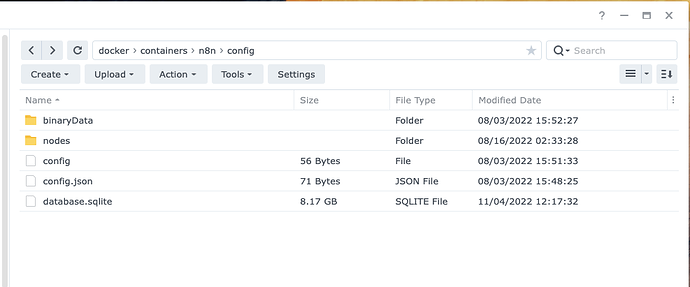
Here is the config files:

Is there a settings to use to purge older than specific time the historical executions?

Hey @ansred,

You were in the right area but we wanted to see the size of the responses rather than the timings, I would expect it to use more memory as more executions are loaded but that looks to be a massive database file for only a few log entries. Are you processing a lot of data or using a lot of static data?

There are environment options to remove old data EXECUTIONS_DATA_PRUNE, EXECUTIONS_DATA_MAX_AGE and DB_SQLITE_VACUUM_ON_STARTUP are the 3 to start with.

Thanks for sharing the env.

What would be the values recommended for each?

EXECUTIONS_DATA_PRUNE
EXECUTIONS_DATA_MAX_AGE
DB_SQLITE_VACUUM_ON_STARTUP

My current docker compose is:

############################################################
version: '3.3'
services:
  n8n:
    container_name: n8n__auto
    ports:
      - 8117:5678
    environment:
      - WEBHOOK_URL=https://###.##.##/
      - EXECUTIONS_PROCESS=main
      - N8N_EMAIL_MODE=smtp
      - N8N_SMTP_HOST=smtp-relay.####.com
      - N8N_SMTP_PORT=587
      - N8N_SMTP_USER=#######@gmail.com
      - N8N_SMTP_PASS=xsmtpsib-##########
      - N8N_SMTP_SENDER=###@###.####
      - N8N_SMTP_SSL=false
    volumes:
      - /volume1/docker/containers/n8n/config:/home/node/.n8n
    image: n8nio/n8n:0.199.0
    restart: unless-stopped

networks:
  default:
    external:
      name: Projects_Core
############################################################

The type of workflows I am using, mixed between static and data (still all within few MB here and there, not that massive though), for a sqlite file, it’s huge I know, which mostly caused by the executions log.

Hey @ansred,

There are no real recommendations other than true for the prune and vacuum options, The other one is the max number of days you want to keep the data for.

EXECUTIONS_DATA_PRUNE - True
EXECUTIONS_DATA_MAX_AGE - The maximum amount of days you want to keep the log for
DB_SQLITE_VACUUM_ON_STARTUP - True
2 Likes

Hi @Jon
Sounds good, I added the three lines to the docker compose.

Restarted container with the latest version, and it’s taking it’s time to do the cleanup as it’s still stuck on

11/04/2022 1:17:41 PM Initializing n8n process

Will give it sometime and capture HAR if needed.

Thanks so far for the help!

Hey @ansred,

It will take a while if it has a lot of data to get through, A HAR file wouldn’t help with the cleaning but it would help see the execution return data if you continue to see the problem on the new version.

Yes, I meant about that, if the executions causes any crashes due to the excessive memory use, will capture the HAR.

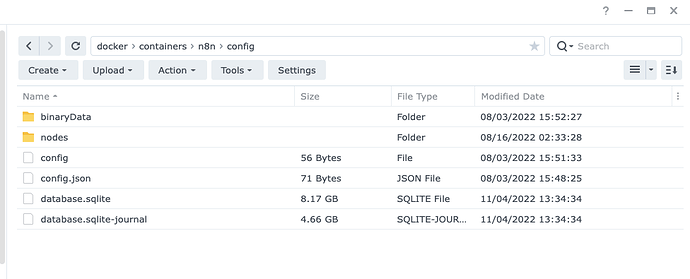
Current state of the files (database.sqlite-journal) keeps increasing, so it’s busy

Hey @ansred,

That looks good so far, It is going to take a while 8GB while fairly small when compared to disks these days it is still a lot of data to process :slight_smile:

1 Like

Here is the result of my testing:

added to the docker compose using latest image release the following extra env:

      - EXECUTIONS_DATA_PRUNE=True
      - EXECUTIONS_DATA_MAX_AGE=30 #The maximum amount of days you want to keep the log for
      - DB_SQLITE_VACUUM_ON_STARTUP=True

Log from the docker container + timestamps


11/04/2022 1:17:41 PM Initializing n8n process
11/04/2022 1:41:55 PM query is slow: VACUUM;
11/04/2022 1:41:55 PM execution time: 1439453
11/04/2022 1:41:59 PM n8n ready on 0.0.0.0, port 5678
11/04/2022 1:41:59 PM Version: 0.201.0
11/04/2022 1:42:00 PM query is slow: DELETE FROM "webhook_entity"
11/04/2022 1:42:01 PM execution time: 1273
11/04/2022 1:42:01 PM ================================
11/04/2022 1:42:09 PM Editor is now accessible via:
11/04/2022 1:42:09 PM http://localhost:5678/

Notes:

Almost 20min to start the container

database.sqlite shrunk from ‘8.17 GB’ to ‘6.56 GB’

still showing 456 records in the executions tab

Later steps taken:

Changed
- EXECUTIONS_DATA_MAX_AGE=14

and disabled (takes very long time to finish)
- DB_SQLITE_VACUUM_ON_STARTUP=True

Final result:
Still memory spikes to more than 3 or 4 GB when opening executions.
+
The executions workflows records still the same (showing almost the same number of workflows even though I made the max to 14 days only)

Hey @ansred,

I would like to go back to a previous question and the request for the size output from the network request.

The previous question I want to focus on is do you use static data in your workflows. Static data is used to store information in a workflow for a next run, if you are not sure if we could find out more about what your workflows are doing that could help.

One of our theories is maybe one record has a lot of data in it and we are not handling it cleanly.

Hi @Jon

So last night finally the workflows got updated to only 2 records! Cleanup happened, not sure exactly when.

database.sqlite is 6.56 GB size

Everything now running within reasonable speed and memory load consumption (~600 MB)

I think the issue being caused in the executions tab by the checkbox on the top right, (Auto Refresh).

Do you think there is an option to permanently disable and refresh when needed?

Size in HAR file when going to (rest/executions-current)

Page global data
Num. requests:
1

Uploaded:
6111 bytes

Downloaded:
669 bytes

If the Auto refresh is enabled, it keeps adding up the size on the memory, hence, memory crash and causing the issue.

Thanks for highlighting these settings.
I am not sure if this works
Just set
- EXECUTIONS_DATA_MAX_AGE=5
- EXECUTIONS_DATA_PRUNE=true

in docker-compose.yml and restarted n8n twice and I still see executions older than 5 days
It did not delete any older entries at all

image

Same happened with me, but try to add this

- DB_SQLITE_VACUUM_ON_STARTUP=True

and let it run once or twice (It will take time)

Thanks @ansred - I already had that setting for a while. That was a lifesaver to reduce the filesize.
I am not sure when this “cleanup” triggers - so far a few minutes in - no change
My settings beyond the default
- EXECUTIONS_PROCESS=main
- EXECUTIONS_DATA_MAX_AGE=5
- EXECUTIONS_DATA_PRUNE=true
- DB_SQLITE_VACUUM_ON_STARTUP=true