Description of my use of n8n :
I’m pulling files from an S3 bucket and post them to my application API.
This because one of my customer did not want to implement the api and just wanted to integrates with an s3 bucket … anyway.
My workflow :
1 - run every 30 seconds (cron trigger)
2 - Scrap file on a s3 ( max 10 at a time to limit downloading size)
3 - batch loop (one at a time)
a - download the file (max file size 50mb)
b - “http request” Post the file on my app API
c - if b step status code = 200 : delete file from s3
How much :
When the workflow is very stressed you can imagine having 10 files every 30 seconds for like couple of hours but never got higher requests rate.
The average size of file is lower than 20mb per file. So you can count 200 MB of file downloaded at each exec during peaks.
My n8n infrastructure :
On kubernetes :
- 5 replicas of n8n-webhooks
- 3 replicas of n8n-workers
- 1 replica of n8n-main
- 1 redis
n8n version: v0.205.0
with config:
NODE_OPTIONS : -max_old_space_size=2048
N8N_DEFAULT_BINARY_DATA_MODE = filesystem
resources:
        limits:
          cpu: '1'
          memory: 2548Mi
        requests:
          cpu: 500m
          memory: 2Gi
I am facing multiple “JavaScript heap out of memory” issues causing
- downtimes
- execution failed in a “no data mode”
What cause the “JavaScript heap out of memory”:
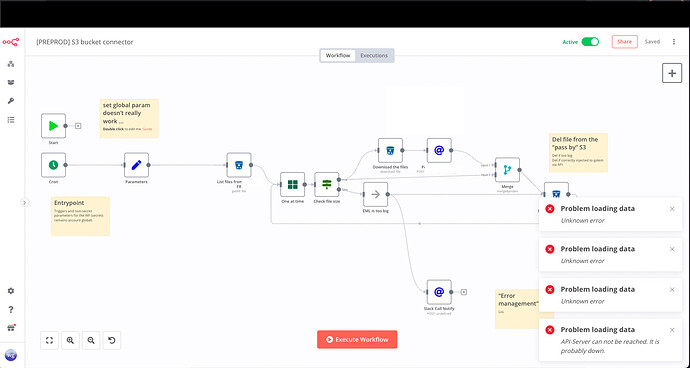
1 - which break the n8n-main : browsing the GUI, loading executions , troubleshooting etc… which sounds like a very common usage of the n8n
2 - which breaks some n8n-workers : being loaded for less than 1 hours with the max consumption described before.
in both case i get the following logs and can see a restart of the pod hosting the node process.
logs :
<— Last few GCs —>
[8:0x7f4454eb8400] 51858290 ms: Mark-sweep (reduce) 2045.4 (2060.3) → 2044.4 (2058.0) MB, 215.1 / 0.1 ms (+ 294.7 ms in 10 steps since start of marking, biggest step 90.6 ms, walltime since start of marking 599 ms) (average mu = 0.462, current mu = 0.18[8:0x7f4454eb8400] 51859022 ms: Mark-sweep (reduce) 2049.2 (2062.1) → 2048.4 (2062.3) MB, 444.6 / 0.2 ms (+ 89.7 ms in 9 steps since start of marking, biggest step 81.7 ms, walltime since start of marking 649 ms) (average mu = 0.367, current mu = 0.270)
<— JS stacktrace —>
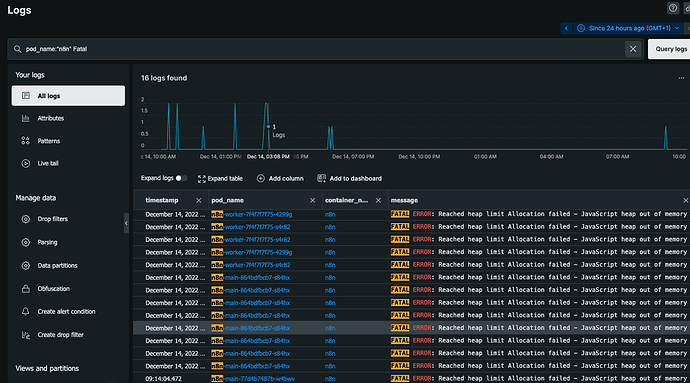
FATAL ERROR: Reached heap limit Allocation failed - JavaScript heap out of memory
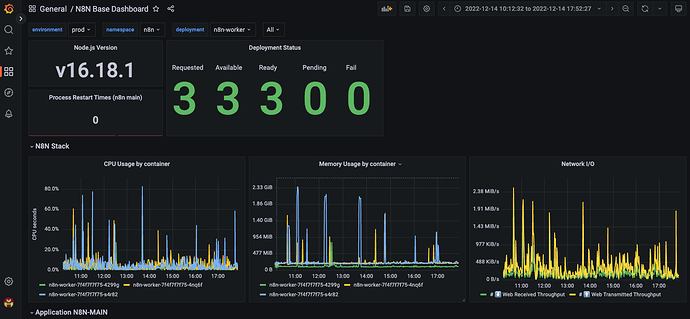
The following screenshot shows the n8n-worker pods you can see the blue line facing multiple memory issues over time.
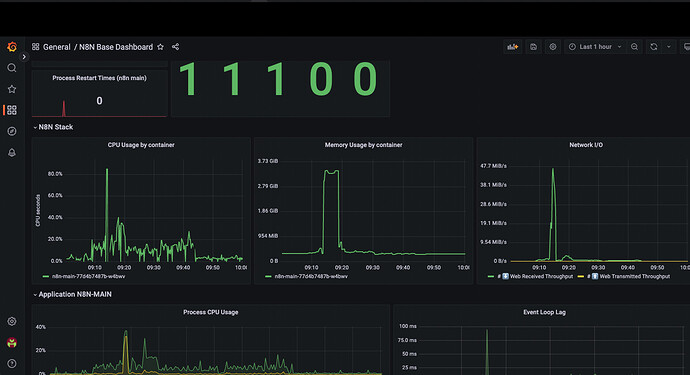
The following screenshots shows the n8n-main pods you can see an exemple of one memory issue i faced browsing/using the UI :
What’s wierd is how fast it get’s to fail… everything is fine then in no time it’s getting to the limit. It really looks like a bug to me. as there is no way thats it’s data from downloading files in my workflow that can get that much GB in such a short time.
Did you find issues with the memory management before?
i found this : https://community.n8n.io/t/javascript-heap-out-of-memory-on-workflow-with-multi-http-request-loops/15372 but even though it’s the same consequences it looks different as it’s the consumption of the workflow exec that generate the memory consumption. In my case i got many exemples of everythings goes well until … for some reason. it reach the limits in few seconds…
Any ideas about how i can avoid this to happen?


