The memory should creep up a bit but then it will sort itself out and level out. Once an execution has finished the memory will automatically be released so there shouldn’t be an issue there, I would however recommend upgrading to 1.1 which has some fixes in it and keep an eye out for the next couple of releases which may include performance tweaks.
Looking at my own docker install it does free up the memory but I would recommend upgrading and starting from there.
How do you currently have n8n installed as well is it with npm / docker and you are using the default database or something else?
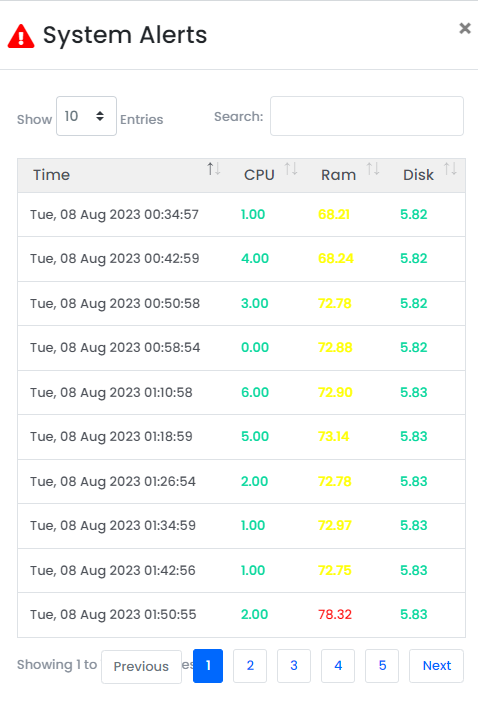
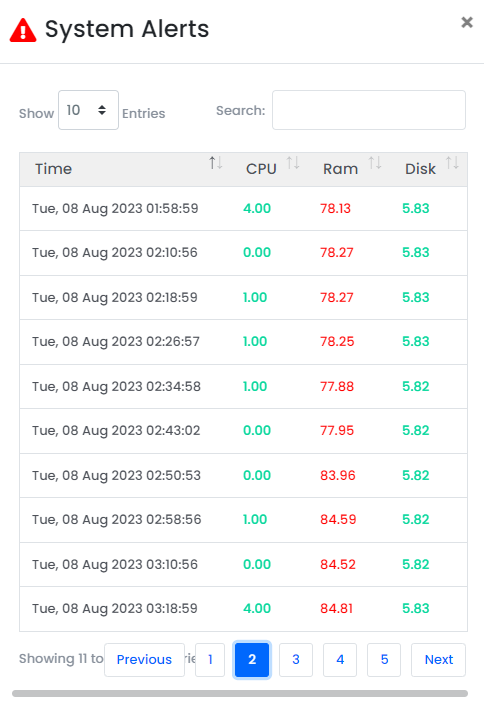
With your stats are those for the n8n process itself or the server itself? If n8n was not freeing up the memory correctly which would be a massive issue you could just restart n8n to free it up rather than the server.
I would imagine if it was an n8n issue we would have a lot of reports of this by now, It might be worth monitoring the n8n application itself though as it could be that there is something else on the server causing an issue.
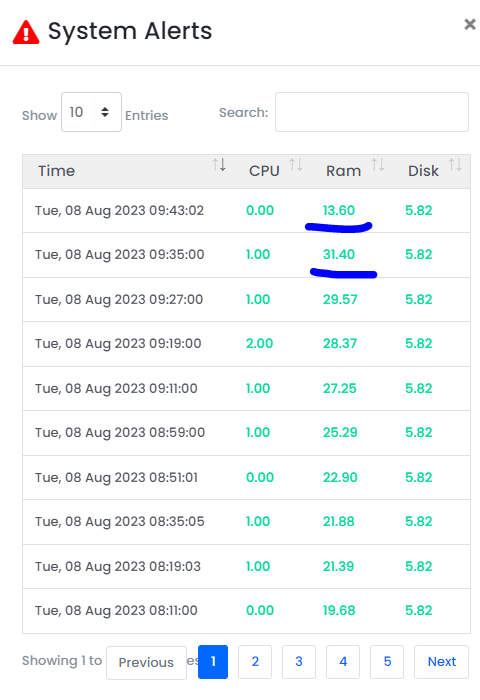
As a test, I took a reading of the current total memory usage of the server before restarting the n8n service alone. Total had crept to 31.4% before and after restarting the n8n service dropped to 13.6 - what would that suggest?
What was n8n doing at the time? Can you also try to monitor the memory for n8n itself which will be more useful while testing
I have done some checks on the memory usage for n8n cloud instances and I am not able to see this same issue there so at the moment this appears to be local to your environment so it would be handy to know more.