Hello, I have a problem. I would like to send an email but I have two details that need to be sent.
The first one generates a table and the second one generates a chart in PNG format. How can I combine these 2 tools to get one? I was thinking about HTML, can anyone help me?
It looks like your topic is missing some important information. Could you provide the following if applicable.
- n8n version:
- Database (default: SQLite):
- n8n EXECUTIONS_PROCESS setting (default: own, main):
- Running n8n via (Docker, npm, n8n cloud, desktop app):
- Operating system:
@Voleniusz , I think that in order to produce a chart you would need to engage such a node as “QuickChart”.
Hi. That’s not quite the point. Since I have already created the chart, I have also created the tables. Now I would like to combine these two things together so that I can send them in an email.
You could maybe try and include your table in the email body and include the chart as an attachment. Another possible option could be to try it with html and see if you can include the image inline that way but from what I remember you would need to convert the image to base64 so it can be displayed.
Thank you for your answer. Can you tell me how I can convert the image I need to convert to base64? is there any tool for this? do I need to send this file again somewhere? ?
I would like to display this chart next to the table and that is what I care about the most.
@Voleniusz , to display the chart image in the email body you need to have it hosted somehwere and then use its URL in HTML format of the email body. That is why I suggested “QuickChart” as it creates and hosts the image for you and allows to access it via URL.
Otherwise you would have to attach the binary file (your chart as an image) to your email.
Here’s a working example of embedding the graph into email. I had to replace “QuickChart” with “HTTP Request” node but still using QuickChart service. You can adjust further how your graph looks like (check QuickChart API). This should give you a good start. Your imaginary table data is in “Code” node. The nodes after that are used to prepare the data for QuickChart API.
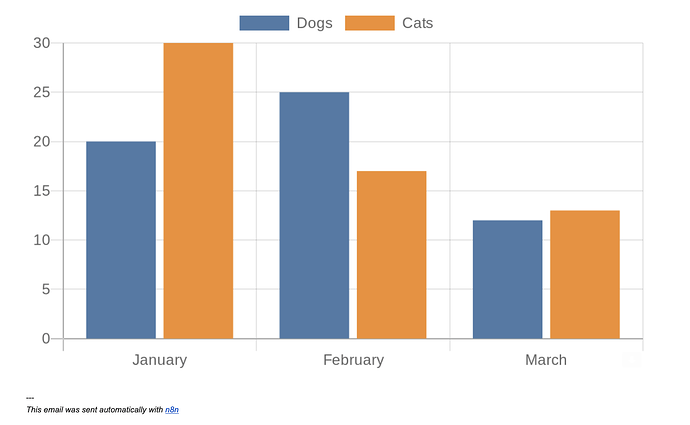
Here’s how it looks like in the email.
This topic was automatically closed 90 days after the last reply. New replies are no longer allowed.
