I’m currently setting up monitoring for my n8n instance and have enabled all available metrics via environment variables. However, I’m still facing some limitations and would love your input or possible workarounds.
Here’s what I’m trying to achieve:
1. Node Errors per Node Type
I’m trying to measure how often individual nodes fail. I assumed I could calculate it like this:
n8n_node_finished_total - n8n_node_started_total
But the numbers don’t match — this doesn’t seem to accurately reflect errors. Is there a metric that explicitly tracks node errors per node type? Or another reliable way to derive this?
2. HTTP Request Executions by Base Path
I want to group executions of the HTTP Request node by base path. For example, if I have:
GET https://google.de/stuff/1
I’d like to track requests (failed, success) under https://google.de, not the full path. Is there any way to get the data and extract or aggregate this somehow ?
3. Average Execution Time per Workflow
I’d like to monitor the average runtime of each workflow. I haven’t found a clear way to get this — is there any metric that provides this directly?
Would appreciate any pointers, workarounds, or insights! Thanks in advance!
To effectively monitor workflow performance and collect relevant data, I recommend implementing two additional workflows and utilizing a centralized storage solution (e.g., Google Sheet or a database) for results.
1. Error Tracking Workflow
This workflow will specifically monitor and log errors occurring within your system.
Trigger Node: Start with an Error Trigger node.
Error Identification:
To identify HTTP request errors, check if execution.error.node.type is equal to n8n-nodes-base.httpRequest.
Alternatively, you can use execution.error.node.name to pinpoint specific nodes, such as "Send Google Request".
Data Storage: If an error matches your criteria, save the execution.error.context.request.uri to your chosen storage for later aggregation.
Date Stamping: It’s also beneficial to save the date of the error. This will be crucial for calculating metrics like “finished vs. failed” ratios.
Integration: To enable this monitoring, add this workflow as the Error Workflow in the Workflow settings of any workflow you wish to track.
2. Average Execution Time Workflow
This workflow will help you track and calculate the average execution time of your workflows.
Trigger Node: Begin with a Webhook node configured to receive the execution ID.
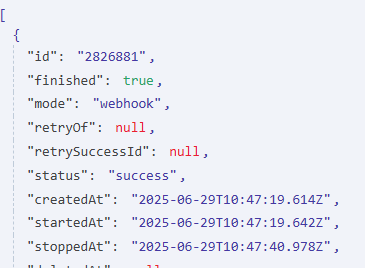
Retrieve Execution Details: Use the n8n Get Execution node to retrieve the full execution details.
Note: You’ll need to configure your n8n credentials for this node; follow the instructions provided within n8n.
Data Extraction: Within the retrieved execution data, you’ll find startedAt and stoppedAt values.
Data Storage: Save these startedAt and stoppedAt values to a separate storage location (e.g., another sheet in your spreadsheet or a different table in your database) for subsequent aggregation.
Integration: As the last step in any workflow you wish to monitor, add a Request node. Configure this node to send a request to the Webhook of your average execution time workflow, including {{ $execution.id }} in the request body or parameters.
Security Best Practices:
Authentication: Implement header authentication for the webhook to prevent unauthorized access.
Internal Calls: When calling this workflow, prioritize using an internal address like http://127.0.0.1:<port>/workflow/<address> to avoid consuming external traffic limits on your servers.
Data Aggregation and Analysis
Once you have established these data collection mechanisms, you can perform the following aggregations:
Counting Failed Google Requests:
Retrieve the failed request entries for your desired date range from storage.
Use an if node with a “starts with” check and the regex ^https:\/\/google\.de to filter specifically for Google requests.
Calculating Average Execution Time:
Retrieve execution entries for the required dates.
Calculate the duration for each execution (stoppedAt - startedAt).
Divide the sum of these durations by the total number of retrieved executions to get the average.
Calculating Error Rate:
Obtain execution entries from your primary storage and error entries (filtered by request URI) from your error storage.
Sum the total number of executions and the total number of errors.
This will provide you with the overall execution count and the error count, allowing you to easily calculate the error rate.
I believe this approach will provide a robust solution for your monitoring and data aggregation needs.