10-K and 10-Q filings are dense. A typical annual report is 80-150 pages. Finding the actual numbers — revenue growth, margins, free cash flow, debt-to-equity — means digging through financial statements, footnotes, and management commentary that can be spread across 40 different pages.
For analysts or investors tracking multiple companies, doing that manually for every filing is hours of work per quarter.
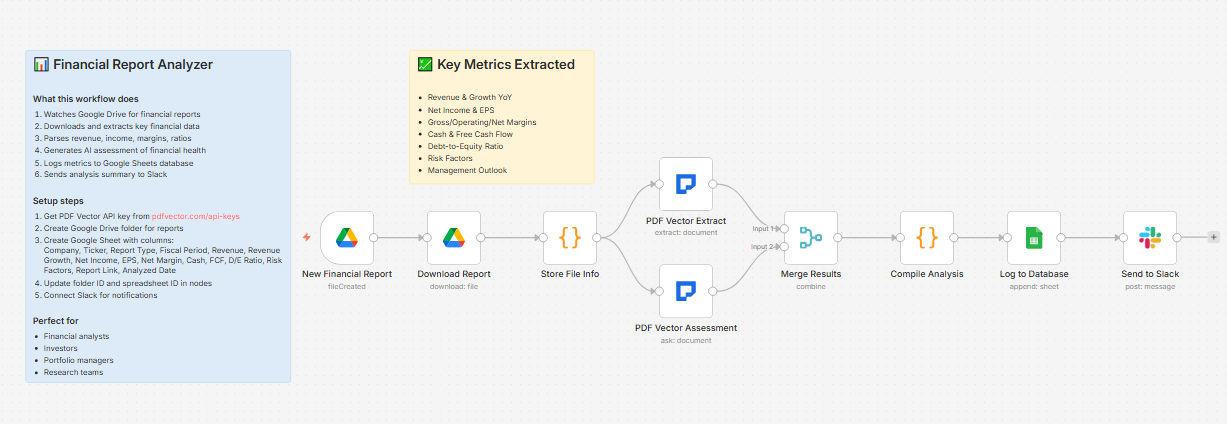
Built a workflow that runs two parallel AI passes on any financial report the moment it lands in Drive — one for structured metric extraction, one for narrative assessment — and delivers a full briefing to Slack in about 20 seconds.
What it does
Financial report dropped in Drive → two parallel passes (structured data + AI assessment) → merges results → formats numbers → logs to financial database → posts full briefing to Slack
Two passes run simultaneously, not sequentially — total time is about 20-25 seconds regardless.
Two parallel passes
Pass 1 — Structured extraction:
Pulls every key metric into typed fields:
-
Company name, ticker, report type (10-K / 10-Q / etc.), fiscal period
-
Revenue and YoY growth %
-
Net income, EPS
-
Gross margin, operating margin, net margin
-
Total assets, total liabilities, shareholder equity
-
Cash and equivalents
-
Long-term debt
-
Free cash flow
-
Risk factors (as array)
-
Management outlook / guidance
Numbers are auto-formatted: $847,300,000 → $847.30M
Debt-to-equity ratio is calculated automatically from extracted figures.
Pass 2 — AI assessment:
Generates a narrative analysis:
-
2-3 sentence executive summary
-
Top 3 positive highlights
-
Top 3 concerns or risks
-
Overall financial health rating: Strong / Stable / Concerning / Weak with justification
Both passes run in parallel on the same document, then merge before Slack notification.
What lands in Slack
📊 Financial Report Analysis

Company: Microsoft Corporation (MSFT)

Report: 10-K - FY2024

💰 Key Financials:

• Revenue: $245.12B

• Net Income: $88.14B

• EPS: $11.80

• Free Cash Flow: $74.07B

• D/E Ratio: 0.31

---

🧠 AI Assessment:

Microsoft delivered exceptional FY2024 results driven by

Azure's 29% growth and accelerating Copilot adoption across

enterprise. The company's shift to AI-integrated services is

successfully commanding premium pricing, with operating margins

expanding to 44.6%.

Top Highlights:

- Azure revenue growth re-accelerated to 29% YoY

- Operating margin expanded 600bps to 44.6%

- $74B free cash flow provides significant capital allocation flexibility

Top Concerns:

- Capital expenditure guidance of $80B+ for FY2025 is unprecedented

- China revenue exposure remains a regulatory risk

- Activision integration costs still weighing on Gaming segment

Overall: Strong — industry-leading margins with durable AI growth tailwinds

---

⚠️ Top Risk Factors (12):

1. Regulatory scrutiny of AI practices and data handling

2. Increasing competition in cloud infrastructure

3. Macroeconomic sensitivity in enterprise IT spending

...

🔗 View Full Report
What lands in Google Sheets
Each row: Company, Ticker, Report Type, Fiscal Period, Revenue, Revenue Growth, Net Income, EPS, Net Margin, Cash, FCF, D/E Ratio, Risk Factors (count), Report Link, Analyzed Date
Build a database of every company you track across multiple quarters. Sort by Net Margin to compare profitability. Filter by Report Type to pull only annual reports.
Setup
You’ll need:
-
Google Drive (folder for financial report PDFs)
-
Google Sheets (free)
-
n8n instance (self-hosted — uses PDF Vector community node)
-
PDF Vector account (~6-8 credits per report for two parallel passes)
-
Slack (for briefings)
About 15 minutes to configure.
Download
Workflow JSON:
financial-report-analyzer.json
Full workflow collection:
Setup Guide
Step 1: Get your PDF Vector API key
Sign up at pdfvector.com — free plan for testing.
Step 2: Create your Drive folder and Sheet
Folder: “Financial Reports” — copy folder ID.
Sheet headers:
Company | Ticker | Report Type | Fiscal Period | Revenue | Revenue Growth | Net Income | EPS | Net Margin | Cash | FCF | D/E Ratio | Risk Factors | Report Link | Analyzed Date
Step 3: Import and configure
Download JSON → n8n → Import from File.
New Financial Report (Drive Trigger):
- Connect Google Drive (OAuth2), paste folder ID
PDF Vector Extract + PDF Vector Assessment:
-
Both run in parallel from Store File Info
-
Add PDF Vector credential to both nodes
Log to Database:
- Connect Google Sheets, paste Sheet ID
Send to Slack:
- Connect Slack, select your finance channel
Accuracy
Tested on 10-K filings, 10-Q filings, and annual reports from US-listed companies.
-
Revenue, net income, EPS: ~96% — prominently displayed in financial statements
-
Margin percentages: ~93% — reliable when explicitly stated; calculated figures occasionally differ by rounding
-
Free cash flow: ~91% — sometimes requires matching the right line item across different reporting formats
-
Risk factors: ~94% — SEC filings have standardized risk factor sections
-
Management outlook: ~88% — qualitative language varies significantly by company
-
AI assessment quality: strong on well-structured SEC filings; more variable on non-US reports with different formats
Important: always verify extracted figures against the source document before any investment decisions.
Cost
~6-8 credits per report (two parallel passes). Free tier of 100 credits covers ~12-15 reports per month.
Customizing it
Track earnings beats/misses:
Add a column for analyst consensus estimates and compare against extracted EPS. Flag beats and misses automatically.
Multi-quarter trending:
Since each filing gets its own row with ticker and fiscal period, you can chart revenue growth, margin trends, and FCF across quarters for any company in your database.
Trigger from email:
Replace the Drive trigger with a Gmail trigger watching for emails from SEC EDGAR or investor relations departments — processes filings the moment they arrive in your inbox.
Disclaimer
This workflow is for research and informational purposes. Extracted figures should be verified against source documents. This is not financial advice.
Questions? Drop a comment.