So, I have checked like you told me.
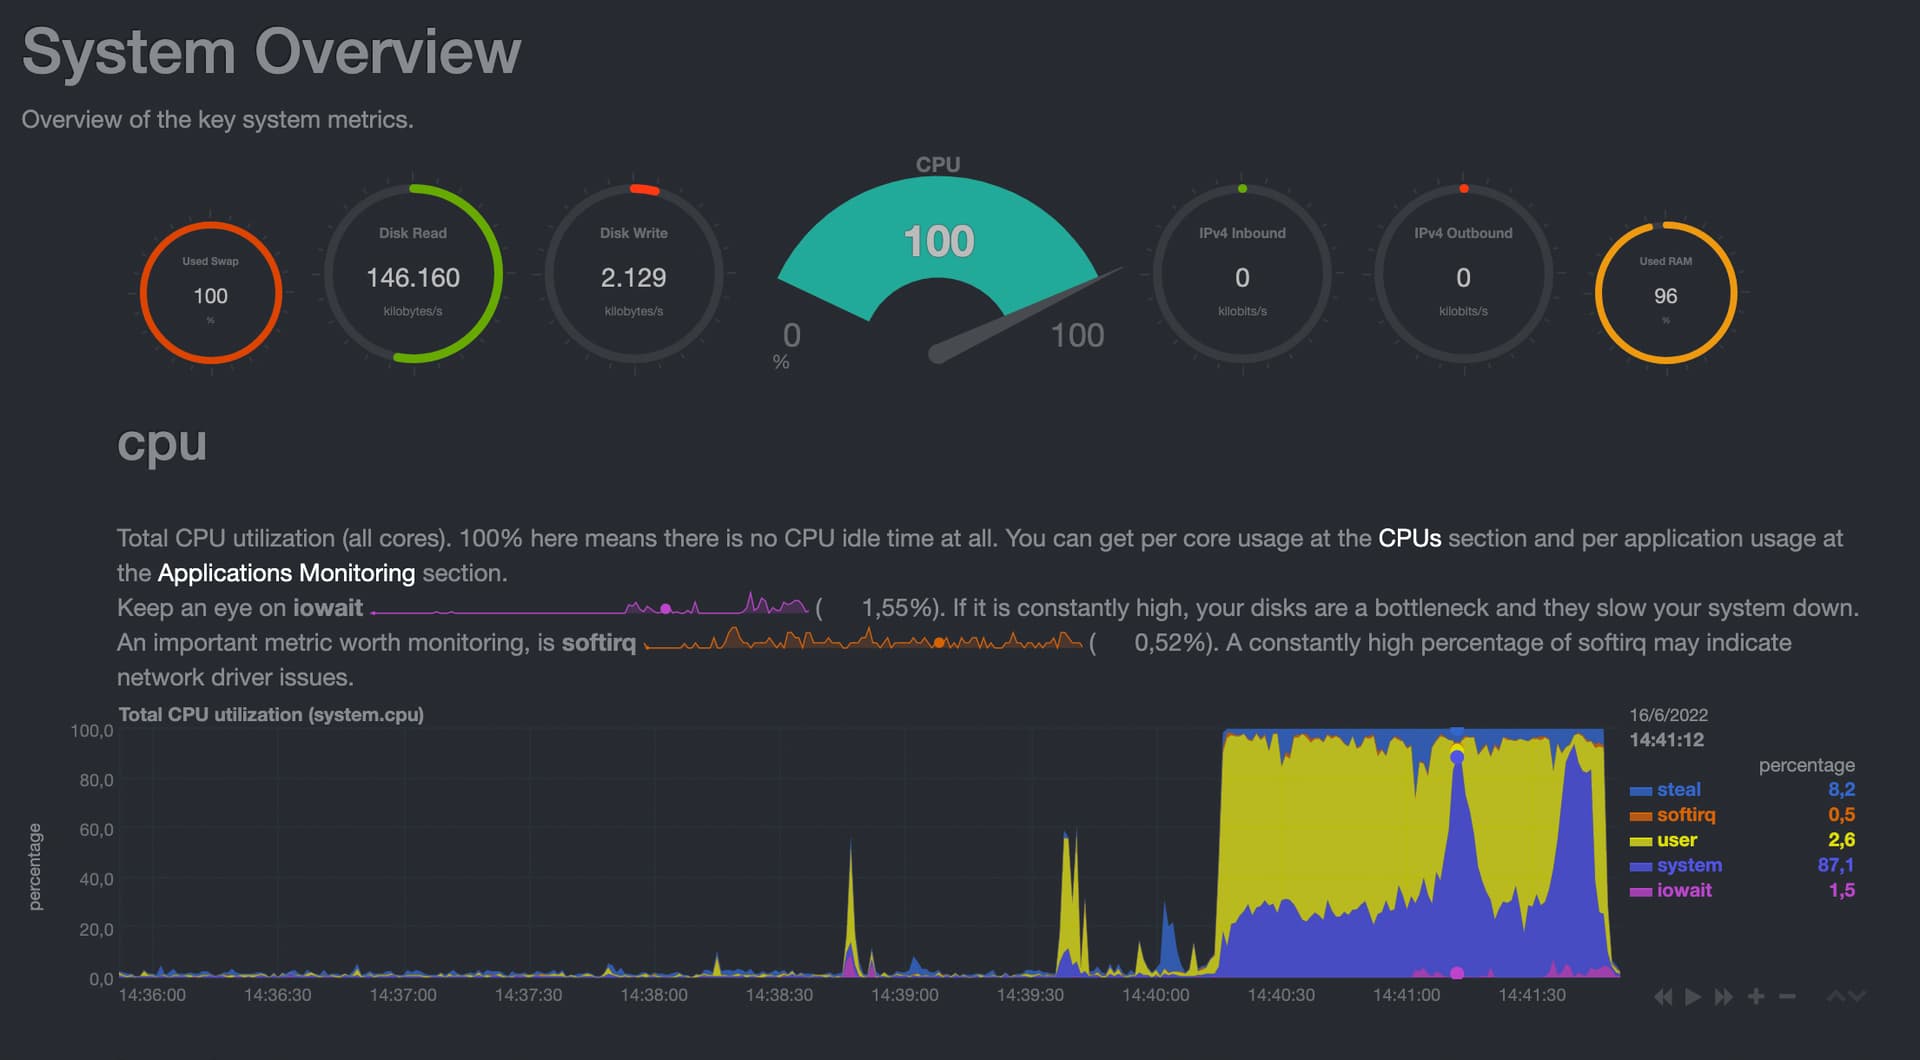
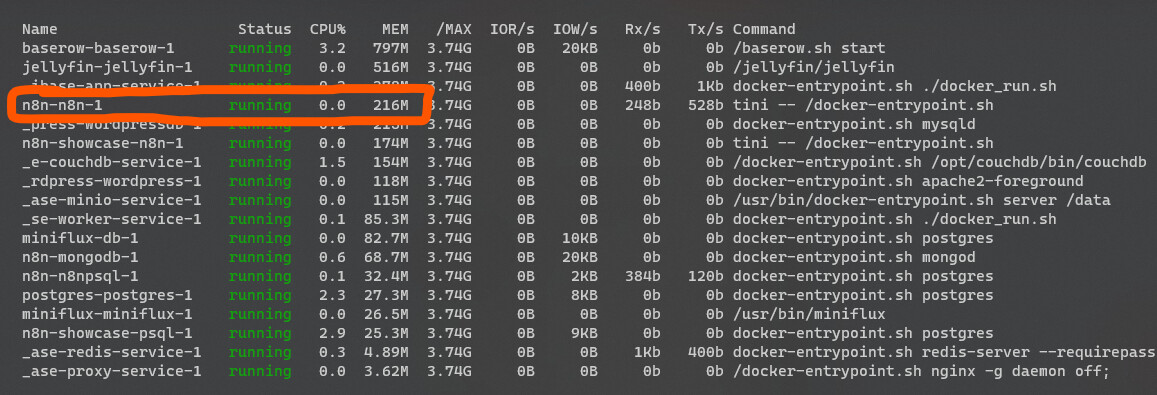
The CPU, and RAM is fine, but the block size is increasing and not going back even after workflow was finished.
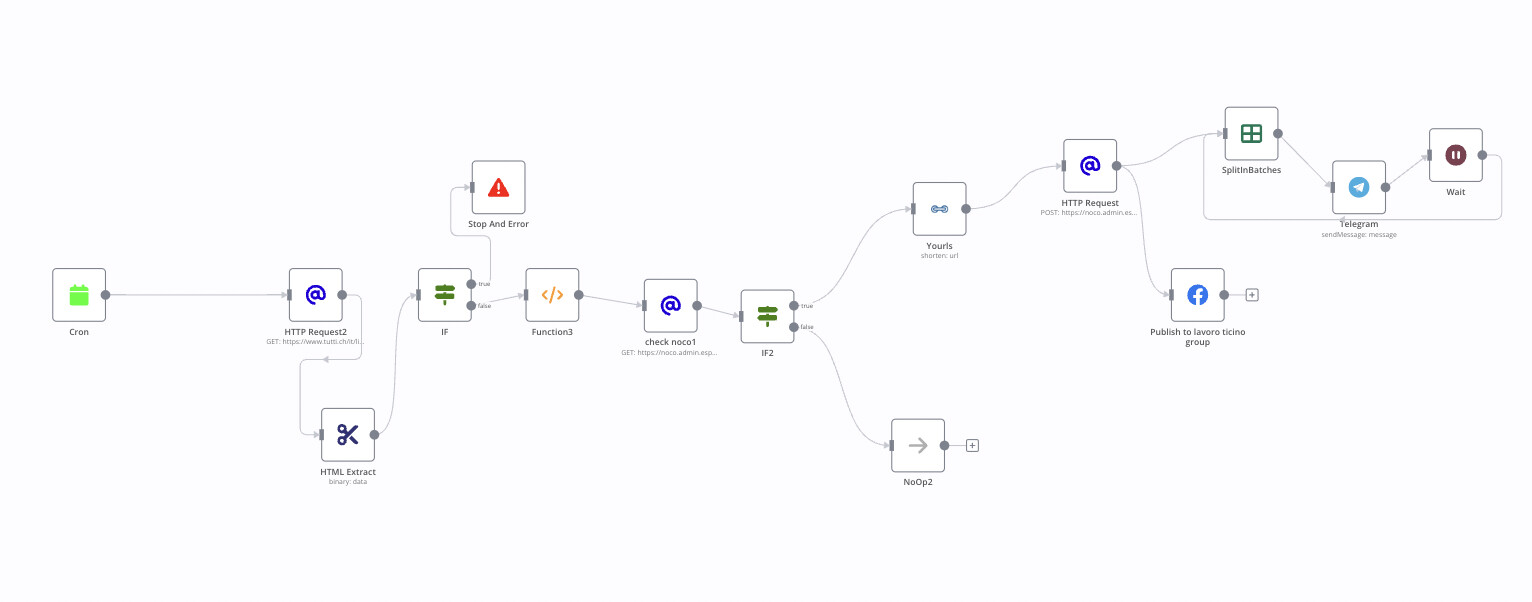
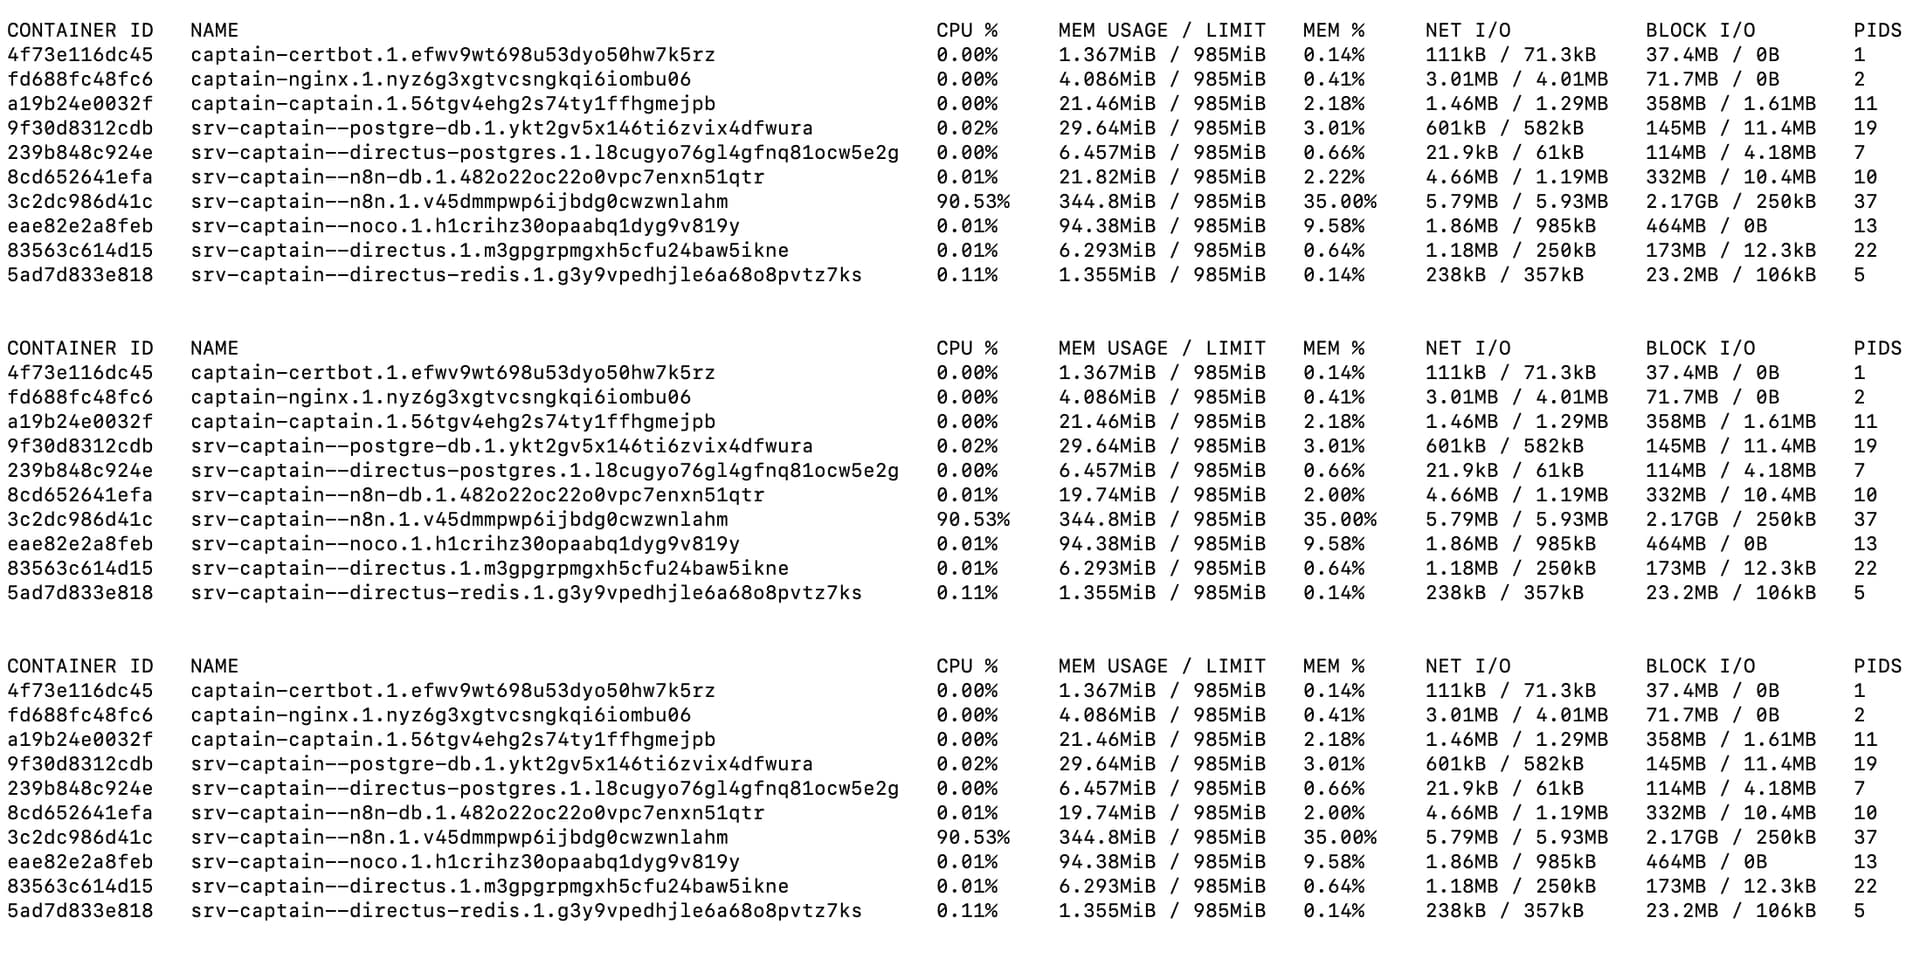
Block size was about 100mb in the start then it was increasing until 700 and during telegram step (seems quite heavy) 1gb - 1,5gb, then workflow has finished and it continued to go up, until 1.7, 1.8 and then it broke with message:
*fatal error: runtime: out of memory*

*runtime stack:*

*runtime.throw(0x5629e7d06eef, 0x16)*

*/usr/local/go/src/runtime/panic.go:1117 +0x74 fp=0x7ffd40786200 sp=0x7ffd407861d0 pc=0x5629e66e7fb4*

*runtime.sysMap(0xc000000000, 0x4000000, 0x5629e9366970)*

*/usr/local/go/src/runtime/mem_linux.go:169 +0xc7 fp=0x7ffd40786240 sp=0x7ffd40786200 pc=0x5629e66ca6e7*

*runtime.(*mheap).sysAlloc(0x5629e934cb60, 0x400000, 0x0, 0x0)*

*/usr/local/go/src/runtime/malloc.go:729 +0x1d4 fp=0x7ffd407862e8 sp=0x7ffd40786240 pc=0x5629e66bd894*

*runtime.(*mheap).grow(0x5629e934cb60, 0x1, 0x0)*

*/usr/local/go/src/runtime/mheap.go:1346 +0x85 fp=0x7ffd40786350 sp=0x7ffd407862e8 pc=0x5629e66d9945*

*runtime.(*mheap).allocSpan(0x5629e934cb60, 0x1, 0x2c00, 0x0)*

*/usr/local/go/src/runtime/mheap.go:1173 +0x609 fp=0x7ffd407863d0 sp=0x7ffd40786350 pc=0x5629e66d9749*

*runtime.(*mheap).alloc.func1()*

*/usr/local/go/src/runtime/mheap.go:910 +0x5a fp=0x7ffd40786420 sp=0x7ffd407863d0 pc=0x5629e671579a*

*runtime.(*mheap).alloc(0x5629e934cb60, 0x1, 0x220000012c, 0xffffffff)*

*/usr/local/go/src/runtime/mheap.go:904 +0x85 fp=0x7ffd40786470 sp=0x7ffd40786420 pc=0x5629e66d8ce5*

*runtime.(*mcentral).grow(0x5629e935ee98, 0x0)*

*/usr/local/go/src/runtime/mcentral.go:232 +0x7b fp=0x7ffd407864b8 sp=0x7ffd40786470 pc=0x5629e66c9cdb*

*runtime.(*mcentral).cacheSpan(0x5629e935ee98, 0x7ffd40786568)*

*/usr/local/go/src/runtime/mcentral.go:158 +0x2ff fp=0x7ffd40786510 sp=0x7ffd407864b8 pc=0x5629e66c9abf*

*runtime.(*mcache).refill(0x7fa1dcf3f108, 0x2c)*

*/usr/local/go/src/runtime/mcache.go:162 +0xac fp=0x7ffd40786558 sp=0x7ffd40786510 pc=0x5629e66c8fcc*

*runtime.(*mcache).nextFree(0x7fa1dcf3f108, 0x7ffd4078652c, 0x5629e6714347, 0x7ffd407865f8, 0x5629e66bf3be)*

*/usr/local/go/src/runtime/malloc.go:882 +0x8d fp=0x7ffd40786590 sp=0x7ffd40786558 pc=0x5629e66be0ed*

*runtime.mallocgc(0x178, 0x5629e8540f40, 0x7ffd40786601, 0x7ffd40786678)*

*/usr/local/go/src/runtime/malloc.go:1069 +0x870 fp=0x7ffd40786618 sp=0x7ffd40786590 pc=0x5629e66beb10*

*runtime.newobject(0x5629e8540f40, 0x5629e6714300)*

*/usr/local/go/src/runtime/malloc.go:1177 +0x3a fp=0x7ffd40786648 sp=0x7ffd40786618 pc=0x5629e66bed7a*

*runtime.malg(0x8000, 0x0)*

*/usr/local/go/src/runtime/proc.go:3988 +0x33 fp=0x7ffd40786688 sp=0x7ffd40786648 pc=0x5629e66f3333*

*runtime.mpreinit(0x5629e9334de0)*

*/usr/local/go/src/runtime/os_linux.go:355 +0x2b fp=0x7ffd407866a8 sp=0x7ffd40786688 pc=0x5629e66e49eb*

*runtime.mcommoninit(0x5629e9334de0, 0xffffffffffffffff)*

*/usr/local/go/src/runtime/proc.go:744 +0xfa fp=0x7ffd407866f0 sp=0x7ffd407866a8 pc=0x5629e66ebefa*

*runtime.schedinit()*

*/usr/local/go/src/runtime/proc.go:637 +0xb3 fp=0x7ffd40786750 sp=0x7ffd407866f0 pc=0x5629e66eba73*

*runtime.rt0_go(0x7ffd40786858, 0x2, 0x7ffd40786858, 0x0, 0x7fa1dc570bf7, 0x2, 0x7ffd40786858, 0x200008000, 0x5629e671cea0, 0x0, ...)*

*/usr/local/go/src/runtime/asm_amd64.s:220 +0x129 fp=0x7ffd40786758 sp=0x7ffd40786750 pc=0x5629e671cfe9*
````Preformatted text`


The question is, should the block size reset after workflow is done?