Hello!
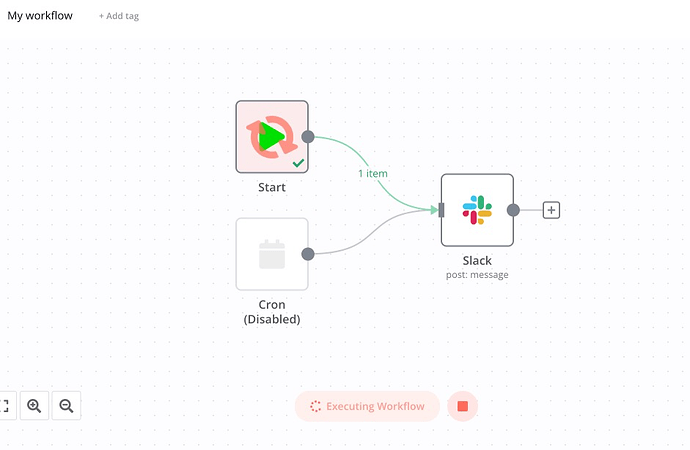
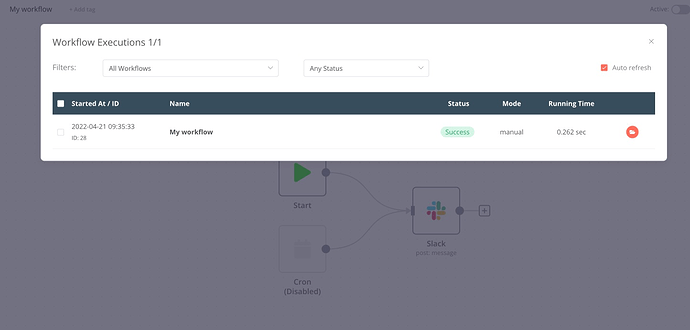
I seem to be seeing a similar issue: Manual workflow executions from the UI do not seem to get execution feedbacks from the servers. The execution completes successfully (I can see it in the history) but the UI seems to hang in the “Executing Workflow” status, with the spinner and the stop button.
When pressing the Stop button, I do get the execution results in the UI (and the notification that the workflow couldn’t be stopped because it already completed).
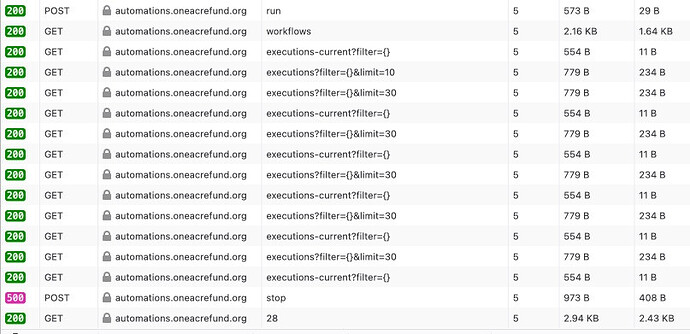
Nothing seems fishy network-wise, all traffic seems to complete happily.
Nothing fishy in the debug logs:
2022-04-21T07:52:12.045Z | debug    | Running node "Slack" started {"node":"Slack","workflowId":"7","file":"WorkflowExecute.js"}
2022-04-21T07:52:12.045Z | debug    | Send data of type "nodeExecuteBefore" to editor-UI {"dataType":"nodeExecuteBefore","sessionId":"icv5ojsyqv","file":"Push.js","function":"send"}
2022-04-21T07:52:12.061Z | debug    | Proxying request to axios {"file":"NodeExecuteFunctions.js","function":"proxyRequestToAxios"}
2022-04-21T07:52:12.292Z | debug    | Running node "Slack" finished successfully {"node":"Slack","workflowId":"7","file":"WorkflowExecute.js"}
2022-04-21T07:52:12.293Z | debug    | Save execution progress to database for execution ID 32  {"executionId":"32","nodeName":"Slack","file":"WorkflowExecuteAdditionalData.js","function":"nodeExecuteAfter"}
2022-04-21T07:52:12.293Z | debug    | Received child process message of type processHook for execution ID 32. {"executionId":"32","file":"WorkflowRunner.js"}
2022-04-21T07:52:12.293Z | debug    | Executing hook on node "Slack" (hookFunctionsPush) {"executionId":"32","sessionId":"icv5ojsyqv","workflowId":"7","file":"WorkflowExecuteAdditionalData.js","function":"nodeExecuteAfter"}
2022-04-21T07:52:12.294Z | debug    | Send data of type "nodeExecuteAfter" to editor-UI {"dataType":"nodeExecuteAfter","sessionId":"icv5ojsyqv","file":"Push.js","function":"send"}
2022-04-21T07:52:12.302Z | verbose  | Workflow execution finished successfully {"workflowId":"7","file":"WorkflowExecute.js","function":"processSuccessExecution"}
I suspect a reverse-proxy-related issue concerning the polling process… Can you advise an expected nginx configuration to support the polling?
The calls to /rest/push?sessionId=xxx are running very long, but I suppose that’s the normal polling design (?) - they used to time out after 60s because of my nginx proxy timeout, so I bumped this up to 1h - I sitll however sometimes get a ‘Connection Lost’ message, but this does not seem to be related to the issue with execution data.
My nginx reverse proxy is the default kubernetes nginx ingress controller, with only these 2 configuration annotations:
    nginx.ingress.kubernetes.io/proxy-read-timeout: '3600'
    nginx.ingress.kubernetes.io/proxy-send-timeout: '3600'
Final notes:
- I have another very similar setup that seems to work fine (although on an older n8n version). The main configuration difference is that the new, failing setup has queue processing enabled.
- Latest 0.173.1
Many thanks!


