Unable to view error executions with strange error in logs

Describe the issue/error/question

Receiving error in interface and in logs when attempting to view failed executions. Nothing loads in the execution display

What is the error message (if any)?

The interface reports:
“Problem loading data: Unknown Error”

and the container log has the following.


2022-12-14T00:37:38.776Z | error    | QueryFailedError: invalid input syntax for type timestamp: "{"_type":"isNull","_useParameter":false,"_multipleParameters":false}" "{ file: 'ErrorReporterProxy.js', function: 'report' }"

Information on your n8n setup

  • n8n version: 0.205.0
  • Database you’re using (default: SQLite): postgres
  • Running n8n with the execution process [own(default), main]: main, worker and webhook processes
  • Running n8n via [Docker, npm, n8n.cloud, desktop app]: docker

Hi @IbnJubayr, I am sorry to hear you’re having trouble. Can you confirm whether this issue persists with the latest version of n8n (0.208.0)? If so, can you share details on how to create an execution that has this problem?

Hi @MutedJam - sorry for the delay in replying, i’ve been away.
Unfortunately I cannot pinpoint what is causing this, but i’ve also noticed another issue now. My workers are no longer processing cron jobs and when I took a deeper look, i found this error in the container logs

redis parser user_script:81: too many results to unpack.

A quick google directed me to this issue, but I am not sure if it is related but we are using n8n in queue mode: @user_script:86: user_script:86: too many results to unpack · Issue #422 · taskforcesh/bullmq · GitHub

I have upgraded n8n to the latest version as of today (0.209.4) and here is a screenshot of my redis keys related to n8n:

image

I am not sure why there are so many in active, as there are no current executions (and i don’t save succesful executions either)

Oh, I am not sure if queue mode could cause such a behaviour either I am afraid, but perhaps @krynble knows more on this topic?

Ah interesting, it seems like Bull was updated and should now work properly with the scenario you have, where there are more than 8k active jobs.

I’ll try updating Bull and see if it works, and then I’ll post it back here. Thanks for reporting @IbnJubayr

1 Like

Thanks @krynble - is there any documentation I can read regarding how queue mode works in detail? Why was there that many active jobs in the list? Did something go wrong and everything stopped processing?

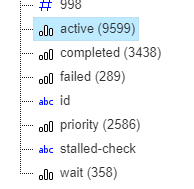
To resolve the issue, I had to delete the active key so that jobs could start getting processed again

Hey @IbnJubayr not exactly - we use the GitHub - OptimalBits/bull: Premium Queue package for handling distributed jobs and messages in NodeJS. as broker for our queue system, so most of the concepts around this tool also apply to our implementation.

As suggested in the link you’ve sent, this is an issue with the underlying LUA script used by the bull system when there were more than 8k active items; it was having issues parsing those.

This can happen if your workers go offline for a while and you have too many jobs piling up and reaching over 8k items in queue.

We have an internal ticket to update the Bull queue system to prevent this issue in the future.

This topic was automatically closed 90 days after the last reply. New replies are no longer allowed.