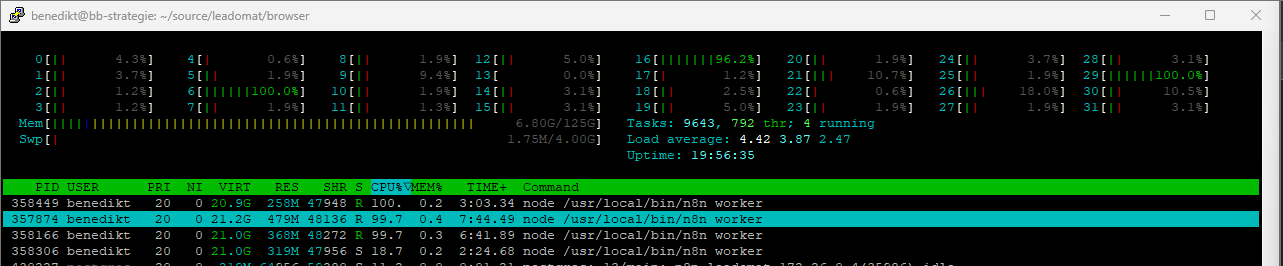
as you can see in the screenshot the worker nodes are goin one by another to 100% workload.
im running the same workflows as before of the upgrade and this problem is new.
there are 4 worker nodes running
what can i do?
as you can see in the screenshot the worker nodes are goin one by another to 100% workload.
im running the same workflows as before of the upgrade and this problem is new.
there are 4 worker nodes running
what can i do?
Docker compose settings for the workers:
services:
  n8n-worker1:
    image: n8nio/n8n:1.1.0
    restart: unless-stopped
    env_file:
      - stack.env
    command: worker --concurrency=20
  n8n-worker2:
    image: n8nio/n8n:1.1.0
    restart: unless-stopped
    env_file:
      - stack.env
    command: worker --concurrency=20
  n8n-worker3:
    image: n8nio/n8n:1.1.0
    restart: unless-stopped
    env_file:
      - stack.env
    command: worker --concurrency=20
  n8n-worker4:
    image: n8nio/n8n:1.1.0
    restart: unless-stopped
    env_file:
      - stack.env
    command: worker --concurrency=20
env:
DB_TYPE=postgresdb
DB_POSTGRESDB_DATABASE=
DB_POSTGRESDB_HOST=
DB_POSTGRESDB_PORT=
DB_POSTGRESDB_USER=
DB_POSTGRESDB_PASSWORD=
N8N_HOST=
N8N_PORT=6678
N8N_ENCRYPTION_KEY=
EXECUTIONS_MODE=queue
QUEUE_BULL_REDIS_HOST=
QUEUE_BULL_REDIS_PORT=
QUEUE_BULL_REDIS_PASSWORD=
REDIS_PASSWORD=
N8N_PAYLOAD_SIZE_MAX=128MB
I had the same issue with 0.236.0 and had to downgrade to fix the issue
which version is working for you?
0.234 and lower
thank you. I started only one worker thread now with --concurrency=20 and its not crashing.
it seems the new version cannot handle multiple worker threads correctly.
Hi folks, I am so sorry for the trouble. Seeing this appears to be queue-mode specific, perhaps @krynble can take a look into this once he’s back next week?
Update: Single worker crashed also, is stucked at 100% CPU
2023-07-27T10:33:33.314Z | info     | Start job: 2768 (Workflow ID: cOZCu8ZMd4UKH13H | Execution: 67800) "{ file: 'worker.js', function: 'runJob' }"
2023-07-27T10:33:33.318Z | verbose  | Workflow execution started "{\n  workflowId: 'cOZCu8ZMd4UKH13H',\n  file: 'WorkflowExecute.js',\n  function: 'processRunExecutionData'\n}"
2023-07-27T10:33:33.318Z | debug    | Start processing node "Schedule Trigger" "{\n  node: 'Schedule Trigger',\n  workflowId: 'cOZCu8ZMd4UKH13H',\n  file: 'WorkflowExecute.js'\n}"
2023-07-27T10:33:33.318Z | debug    | Running node "Schedule Trigger" started "{\n  node: 'Schedule Trigger',\n  workflowId: 'cOZCu8ZMd4UKH13H',\n  file: 'WorkflowExecute.js'\n}"
2023-07-27T10:33:33.318Z | debug    | Running node "Schedule Trigger" finished successfully "{\n  node: 'Schedule Trigger',\n  workflowId: 'cOZCu8ZMd4UKH13H',\n  file: 'WorkflowExecute.js'\n}"
2023-07-27T10:33:33.318Z | debug    | Save execution progress to database for execution ID 67800  "{\n  executionId: '67800',\n  nodeName: 'Schedule Trigger',\n  file: 'WorkflowExecuteAdditionalData.js',\n  function: 'nodeExecuteAfter'\n}"
2023-07-27T10:33:33.320Z | debug    | Start processing node "Code5" "{\n  node: 'Code5',\n  workflowId: 'Bn6rSUY2tjA2s120',\n  file: 'WorkflowExecute.js'\n}"
2023-07-27T10:33:33.320Z | debug    | Running node "Code5" started "{\n  node: 'Code5',\n  workflowId: 'Bn6rSUY2tjA2s120',\n  file: 'WorkflowExecute.js'\n}"
2023-07-27T10:33:33.323Z | debug    | Running node "Code5" finished successfully "{\n  node: 'Code5',\n  workflowId: 'Bn6rSUY2tjA2s120',\n  file: 'WorkflowExecute.js'\n}"
2023-07-27T10:33:33.323Z | debug    | Save execution progress to database for execution ID 67799  "{\n  executionId: '67799',\n  nodeName: 'Code5',\n  file: 'WorkflowExecuteAdditionalData.js',\n  function: 'nodeExecuteAfter'\n}"
2023-07-27T10:33:33.325Z | debug    | Start processing node "SavePlaces2" "{\n  node: 'SavePlaces2',\n  workflowId: 'cOZCu8ZMd4UKH13H',\n  file: 'WorkflowExecute.js'\n}"
2023-07-27T10:33:33.325Z | debug    | Running node "SavePlaces2" started "{\n  node: 'SavePlaces2',\n  workflowId: 'cOZCu8ZMd4UKH13H',\n  file: 'WorkflowExecute.js'\n}"
Hi @Benedikt_Bohm, I’ve brought this up with the team in the meantime and we suspect this might be specific to your (and @Kent1’s) workflows which is why we are having such a hard time reproducing the problem. Any chance you can narrow this down to a specific workflow?
From my side it’s really hard to say witch workflows Can cause the problem as we have plenty that execute in same time.
But for what I saw the problem comes from postgres that have too many actives sessions compare to now
tested with max connection count from postgres with 25000 no difference
I cannot say which workflow is cause the problem because the log stops at different times, it seems verry random but only when many executions are active at the same time
Hey all. Sorry to hear you’re having trouble.
It’s def odd - v1 did not make any relevant changes to queue mode itself but rather we’ve implemented a new execution runtime that should not cause workflows to spike 100% CPU.
If you haven’t rolled back yet, might I suggest disabling non-urgent workflows to try to isolate the problem?
Usually the Code node can cause n8n to spike CPU since it allows you to write blocking code that consumes too many resources, possibly causing n8n to become unresponsive. Do you think this could be the case?
Also I see you’re saving execution progress to DB, this is known to cause n8n to run slightly slower at the cost of giving you more resiliency in the case of a crash. If not necessary, maybe you can disable this setting to test the behavior.
I hope those steps can help us narrow down the problem.
execution progress to DB is now set to false
my “base” workflow is triggering other workflows by http request
so one start of a workflow can trigger many other workflows and waiting for a response to process the request.
in the old version of n8n this is working great but in the actual version not,
so idk why you say the workflow is now blocking itself when it has worked before.
got a workarround for 1.1.0
make 100 worker nodes with concurrency 1 so one worker cannot block itself.
the overhead is crazy but its working for now.
let me know when youre ready to find some good solution with me
@krynble
  n8n-worker1:
    image: n8nio/n8n:1.1.0
    restart: unless-stopped
    env_file:
      - stack.env
    command: worker --concurrency=1
Hey @Benedikt_Bohm,
Did you review the 1.0 migration guide? It sounds like one of your workflows is being impacted by a general change that we made so you may need to tweak your workflow design.
I would start by following the advice previously given and disable some of your workflows to try and narrow down which one is likely to be causing the issue since the update. In theory as you are running 100 workers now you might actually be able to track it down from the logs though so it woudl be worth keeping an eye on them.
Hi @Jon ,
thats interesteing. With 100 workers and concurrency 1 everything works fine.
With general change you mean the execution runtime?
I Imported the workflows over the API the default setting for the execution order is v0.
i will try now to run them in v1.
Maybe the code blocks having blocking codes so i need to fix that.
This topic was automatically closed 90 days after the last reply. New replies are no longer allowed.