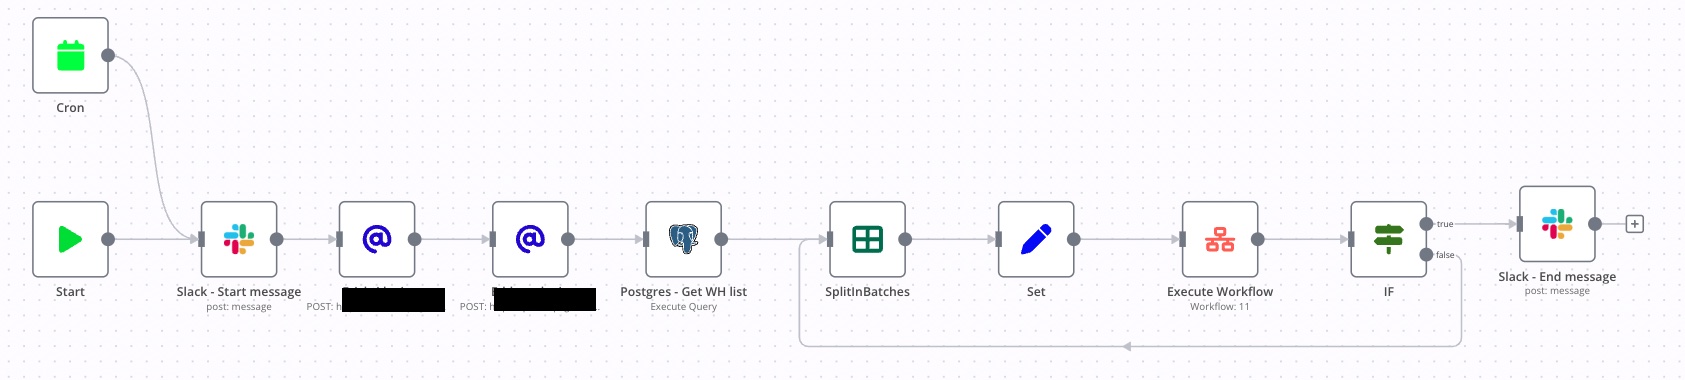
I create a workflow to import data from one system to another. This workflow is divide in 2 different workflow :
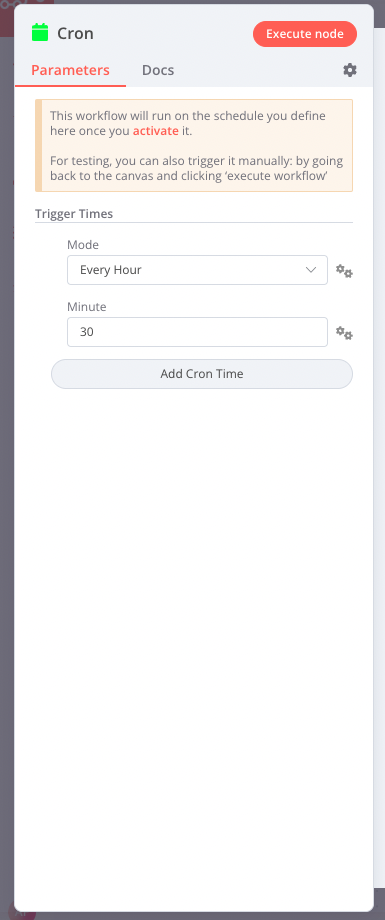
Main Workflow : Trigger by a CRON
Sub Workflow : Trigger by the Main Workflow to do the computation
This entire workflow works well when I trigger it manually from the N8N interface. But with the CRON it always crashes with the error : “Workflow execution process did crash for an unknown reason!” after one successful Sub workflow iteration.
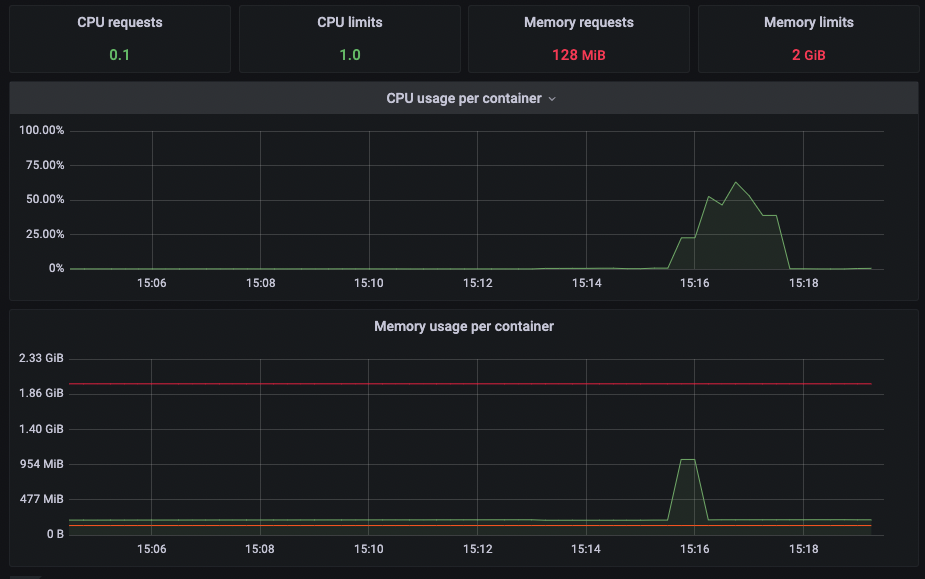
We already check that the pod is not restarting and there is still memory and cpu available when the error is triggered ! Can you help me on how I can investigate this issue ?
Please share the workflow
I cannot share the workflow for confidential reasons but here are some screenshots
After testing triggering the main workflow using a webhook I get the same result : Workflow execution process did crash for an unknown reason! after the first iteration.
Hi @aburio, I am very sorry to hear you’re having trouble. Could you check the docker logs for your n8n instance? Is there any additional indicator as to what might have happened?
Does this happen for all of your workflows using the Cron node (and even for cases where no other node is being used in your workflow)?
Jun 22, 2022 @ 15:16:07.101	<--- Last few GCs --->
Jun 22, 2022 @ 15:16:07.101	FATAL ERROR: Ineffective mark-compacts near heap limit Allocation failed - JavaScript heap out of memory
Jun 22, 2022 @ 15:16:07.101	[41:0x7fc3060ba330]    50988 ms: Scavenge 1018.7 (1038.9) -> 1017.9 (1043.4) MB, 2.6 / 0.0 ms  (average mu = 0.266, current mu = 0.216) allocation failure
Jun 22, 2022 @ 15:16:07.101	[41:0x7fc3060ba330]    52623 ms: Mark-sweep (reduce) 1019.8 (1043.4) -> 1019.1 (1038.4) MB, 1078.1 / 0.1 ms  (+ 545.1 ms in 31 steps since start of marking, biggest step 73.1 ms, walltime since start of marking 1635 ms) (average mu = 0.172, current mu = 0
Jun 22, 2022 @ 15:16:07.101	<--- JS stacktrace --->
What is strange is that we still have memory available…
Oh, so running out of memory would explain why n8n shows an unknown reason (as it is not aware of the memory consumption).
It’s odd this doesn’t happen when manually executing your workflow though. Is there a chance you were processing different amounts of data when manually executing your flow compared to the production execution?
We have the exact same issue in the exact same use-case in v0.201.0, the amount of data returned is extremely low and far from what our other workflows can handle. It still breaks on every CRON trigger but never on a manual execution.
(Sadly cannot share the workflow for confidential reasons either)
Hi @Eliott_Audry, I am very sorry for this. Without a reproducible example it’s really hard to understand what be happening here.
That said, n8n has changed a bit in the past and the Schedule trigger node has been introduced to replace the Cron node. Perhaps you can verify on your end whether this issue still persists on the latest available version of n8n when using the Schedule node instead of the Cron one?