Workflow on worker taking a lot more memory than on main

I got some difficulties with a workflow. When testing I am getting this result:

workflow of 2 nodes started by production url webhook doesn’t finish (worker server)
image
log:


No other executions running at that time.

same workflow but then with more nodes does work fine when running manually (main server)


(adding more nodes here will break it because of RAM limitations of the instance)

The kicker is that the main server has 1GB RAM docker container limited to 650MB
The worker has 2GB RAM docker container limited to 1650.

I have been messing around with this a bit now and cannot figure out why this is happening.

Information on your n8n setup

  • n8n version: 0.216.2
  • Database you’re using (default: SQLite): mysql
  • Running n8n with the execution process [own(default), main]: queue ( so main )
  • Running n8n via [Docker, npm, n8n.cloud, desktop app]: Docker

You should try to break up your workflow into smaller data units, using the Split in Batches node, it’ll help you process the same amount of data but use a bit less memory

Sounds very strange. Maybe @netroy has an opinion on this?

1 Like

Hi @netroy
Do you have any idea why this is happening?
And more importantly, how to fix it? :slight_smile:

Would really like an answer here. :slight_smile:

Really super confusing! Never seen that before. Are you really sure that all n8n instances are running the same n8n version? Is there for sure nothing else on the worker running which eats up memory?

Hi @jan

Yes, just tested it again.
there is nothing running and then I started it:

edit:
sorry missed the question.
All running on 0.216.2

htop screenshot while it was running. :

I get the feeling the limit of 1650 I set in Docker isn’t the actual limit used. As it seems to crash way before the limit is in use.

So I checked the limit with docker it self. (instead of portainer.)
While running, this does not go over 900MiB and then crashes

I’ve now made my own test data set and ran a flow on my own server and the AWS server. The differences are the hosting and also the version. My own server is on the latest (220) version.

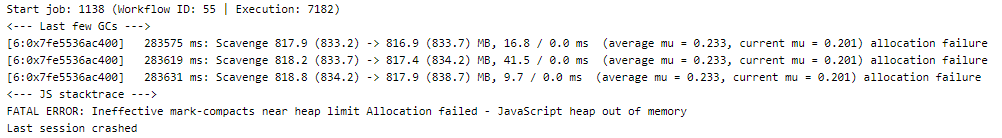
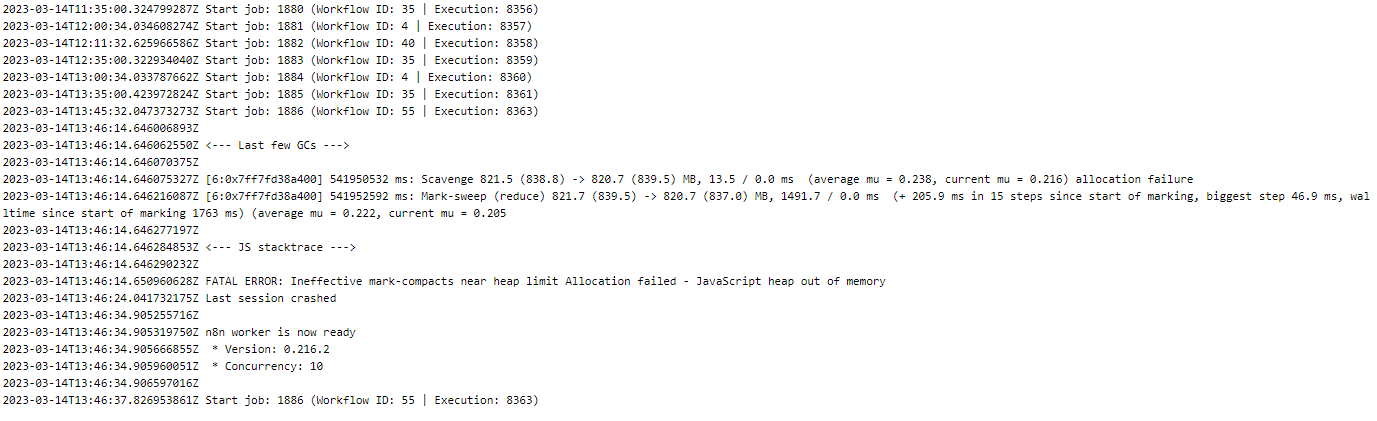
The difference is extreme. Can it be the version (216.2)?
I will update when I can, but couldn’t do it right away.
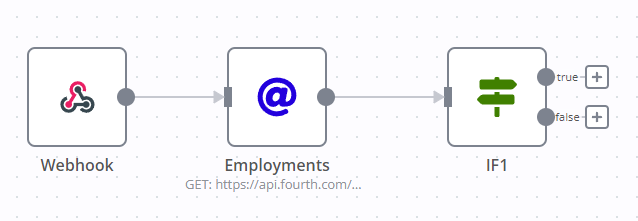
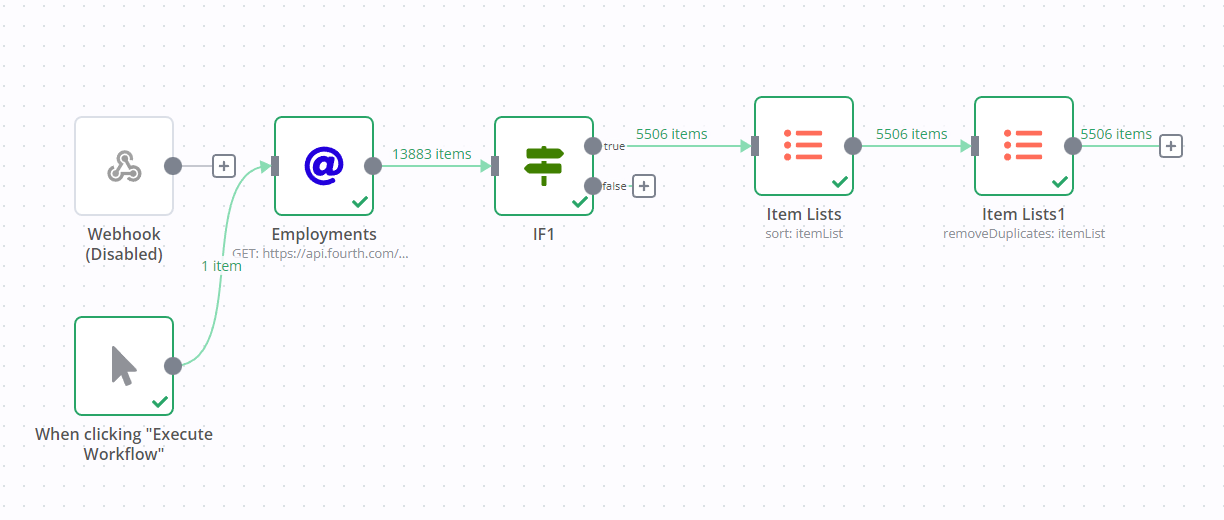
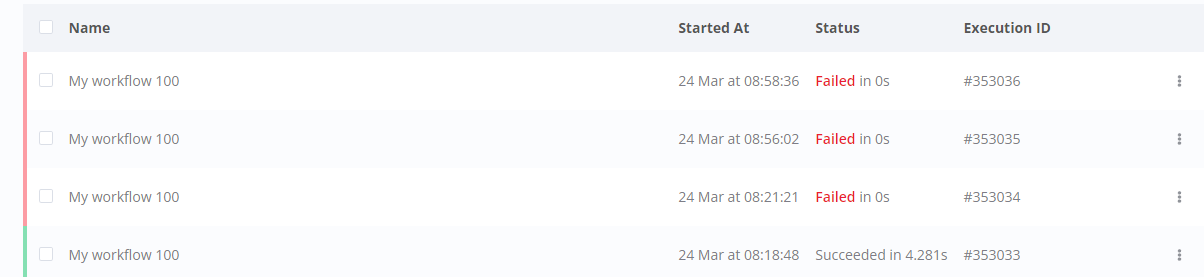
workflow

My server

AWS

All tests were with webhook → worker only doing this no other workflows running at the same time.

1 Like

Just updated the server and the issue is still there.
I have no idea how this can be happening. Does anyone have an idea?

Server:
AWS Lightsail instance 2 Gb on worker, 1Gb on Main instance (2 separate instances)


(graph thing crashed after this)

@BramKn Can you please also try versions 0.217.2, 0.218.0, and 0.219.1?
There are way too many changes between 0.216.x and 0.220.x. If you can help us narrow down the issue to a specific version, that could really help find what’s causing this.

Hi @netroy

The issue exists on 216 and on 220. So not sure what it will add to the conversation if I also test the ones in between.
Of course I can but will take some time, so I want to make sure it is useful. :slight_smile:

Not sure if you noticed, but the issue seems to be specific to AWS lightsail.

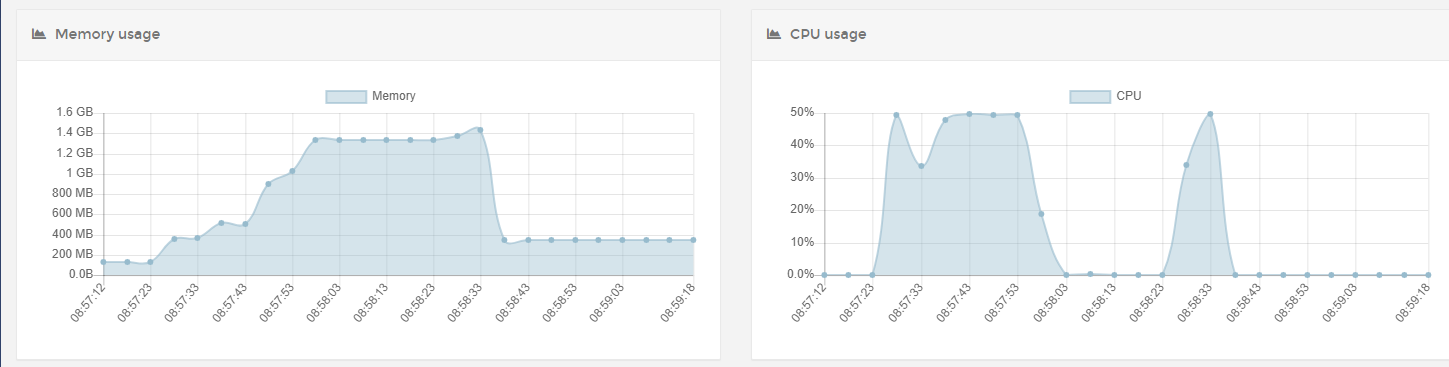
The only major difference between Lightsail vs a local server would be the amount of CPU available, which lead to difference in performance during garbage collection.
Considering the size of the JSON file being downloaded in the HTTP Request node, and that the Lightsail server has likely only one core available, I have a strong suspicion that garbage collection has something to do with this issue.

The reason I asked for testing other versions was because somehow I got the impressions that things were better before 216.2. But now that I read the thread again, I’m not sure what made me come to that conclusion. Sorry about that.

That said, I’m still not sure why queue mode would take more memory than main mode in this case :thinking:

That is a good catch.
Then I would be able to reproduce it by limiting the cpu on my instance to see what it does I guess?

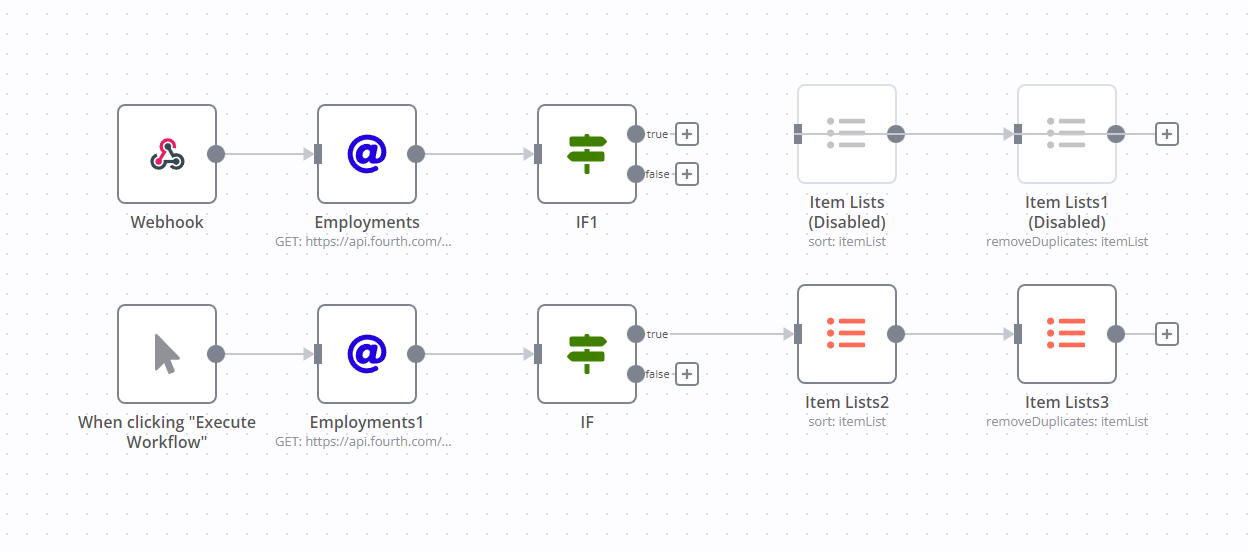
It is queue worker (activated triggered with webhook) vs queue manual trigger.
I am going to do a bit more testing tomorrow to see what I can find out.

1 Like

Hi @netroy

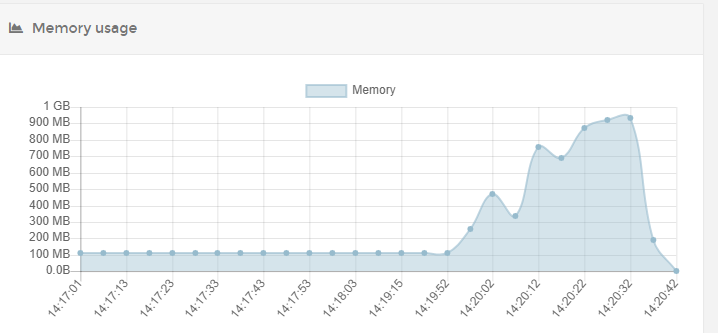
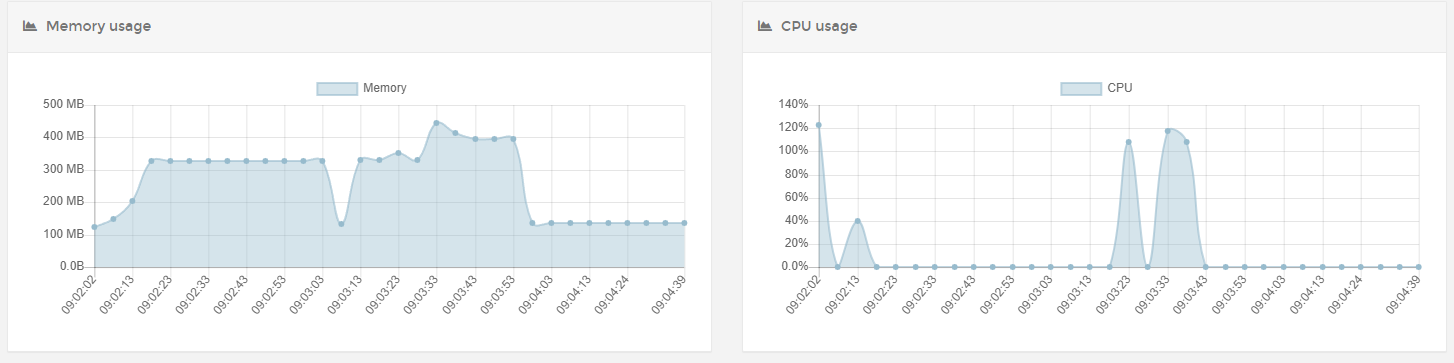
So you were right. Put my server on .5 cpu, and got the same result. now not crashing as it actually had more RAM to play with but you do see that the RAM goes up a lot.

Strangly, the workflow actually succeeded at first and after it showed as failed. (around the time the second spike happened on the CPU I think)


edit: giving it 1.25 cpu fixes it, also when starting 3 webhooks directly after eachother

1 Like

This topic was automatically closed 90 days after the last reply. New replies are no longer allowed.