Workflows get stuck indefinitely // v2.0.0 // Queue + External task runners

Describe the problem/error/question

We are running a self-hosted n8n installation and are currently configuring queue mode with task runners for production scalability. However, we are experiencing a critical issue where workflows get stuck in the queue indefinitely and never complete execution. This affects all workflow types (manual, webhook-triggered, and scheduled executions).

Key symptoms:

  • Workflows are enqueued successfully (we see “Enqueued execution X (job Y)” in logs)
  • Workers never pick up jobs from the Redis queue Executions remain in “running” state indefinitely
  • No actual workflow execution occurs

Infrastructure details:

  • Multi-service architecture: Master (UI), Webhook, and Worker services
  • All services deployed on AWS ECS Fargate
  • Redis (AWS ElastiCache) as queue backend
  • PostgreSQL (AWS RDS Aurora) as database

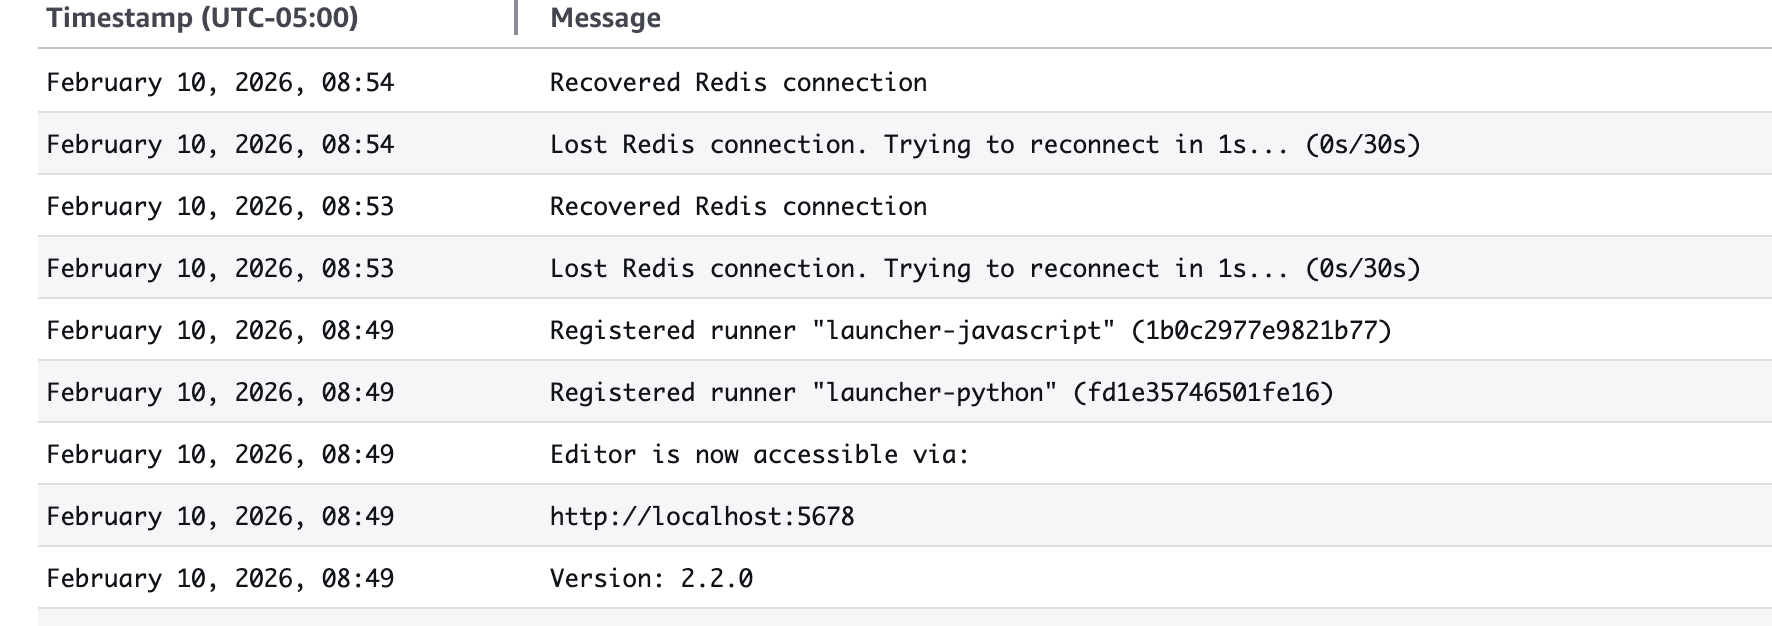
Pattern: Redis connection drops occur every 1-3 minutes across all services, followed by immediate reconnection.

What is the error message (if any)?

Master service logs:

Lost Redis connection. Trying to reconnect in 1s... (0s/300s)
Recovered Redis connection
Error handling CollaborationService push message
Error: Error handling CollaborationService push message
invalid input syntax for type uuid: "undefined"

Worker service logs:

Lost Redis connection. Trying to reconnect in 1s... (0s/300s)
Recovered Redis connection
Last session crashed

Please share your workflow

This issue affects ALL workflows regardless of complexity. Even simple test workflows with a single HTTP Request node get stuck in queue.

Share the output returned by the last node

No output is generated because workflows never execute - they remain queued indefinitely.

Information on your n8n setup

  • n8n version: v2.0.0
  • Database (default: SQLite): PostgreSQL (AWS RDS Aurora)
  • n8n EXECUTIONS_PROCESS setting (default: own, main): own
  • Running n8n via (Docker, npm, n8n cloud, desktop app): Docker containers on AWS ECS Fargate
  • Operating system: Linux containers

Environment variables by service:

Master service (exclusive variables):

N8N_WORKER_MODE=master
N8N_DISABLE_PRODUCTION_MAIN_PROCESS=false

Webhook service (exclusive variables):

N8N_DISABLE_PRODUCTION_MAIN_PROCESS=false

Worker service (exclusive variables):

N8N_DISABLE_PRODUCTION_MAIN_PROCESS=true
N8N_CONCURRENCY_PRODUCTION_LIMIT=-1

Runner service (exclusive variables):

N8N_RUNNERS_AUTO_SHUTDOWN_TIMEOUT=0

Shared environment variables (all services):

Database Configuration

DB_TYPE=postgresdb
DB_POSTGRESDB_HOST=xxyyzz
DB_POSTGRESDB_PORT=5432
DB_POSTGRESDB_DATABASE=automation
DB_POSTGRESDB_SCHEMA=public
DB_POSTGRESDB_SSL_REJECT_UNAUTHORIZED=false
DB_POSTGRESDB_POOL_SIZE=10
DB_POSTGRESDB_CONNECTION_TIMEOUT=20000

Redis Queue Configuration

QUEUE_MODE=redis
QUEUE_BULL_REDIS_HOST=xxyyzz
QUEUE_BULL_REDIS_PORT=6379
QUEUE_BULL_REDIS_USERNAME=default
QUEUE_BULL_REDIS_TLS=true
QUEUE_HEALTH_CHECK_ACTIVE=true
QUEUE_BULL_REDIS_CONNECTION_TIMEOUT=30000
QUEUE_BULL_REDIS_TIMEOUT_THRESHOLD=30000
QUEUE_BULL_REDIS_DB=0

Execution Configuration

EXECUTIONS_MODE=queue
OFFLOAD_MANUAL_EXECUTIONS_TO_WORKERS=true
N8N_RUNNERS_ENABLED=true
N8N_RUNNERS_MODE=external

Network & URL Configuration

WEBHOOK_URL=https://n8n-webhook.company.io
N8N_EDITOR_BASE_URL=https://n8n.company.io
N8N_HOST=n8n.company.io
N8N_PORT=5678
N8N_PROXY_HOPS=1

Security & Permissions

N8N_ENFORCE_SETTINGS_FILE_PERMISSIONS=true
N8N_BLOCK_ENV_ACCESS_IN_NODE=true
N8N_GIT_NODE_DISABLE_BARE_REPOS=true

Operational Settings

N8N_METRICS=true
N8N_GRACEFUL_SHUTDOWN_TIMEOUT=30

License Configuration

N8N_LICENSE_AUTO_RENEW_ENABLED=true
N8N_LICENSE_DETACH_FLOATING_ON_SHUTDOWN=false

Custom Nodes Configuration

N8N_CUSTOM_EXTENSIONS=/home/node/.n8n/custom

Architecture:

  • Master service: Handles UI and API (1 instance)
  • Webhook service: Handles webhook endpoints (1-3 instances, auto-scaling)
  • Worker service: Processes queue jobs (1-3 instances, auto-scaling)
  • Runner service: External task runners

Has anyone experienced this behavior before? Looking at our environment variables configuration, do you notice any obvious misconfigurations that could prevent workers from picking up jobs from the Redis queue? We’re particularly concerned about the frequent Redis reconnections and whether our queue mode + task runners setup might have conflicting settings.

Hi @JavierOrjNeq Upgrading your n8n instance would help a lot in this, and increasing redis timeout and keeping it alive would help resolving the issue of workflows getting stuck, and you can also verify the REDIS on AWS’s end to set its parameter higher, hope this helps.

Hi @Anshul_Namdev , how’s it going?

I was performing the version upgrade to 2.7.0, as well as adding the Redis keep-alive variables. However, this hasn’t solved the issue of workflows being permanently queued.

Master Service - Logs:

Worker Service - Logs:

Webhook Service - Logs:

### core

- n8nVersion: 2.7.0
- platform: docker (self-hosted)
- nodeJsVersion: 22.22.0
- nodeEnv: production
- database: postgres
- executionMode: scaling (single-main)
- concurrency: -1

### storage

- success: all
- error: all
- progress: false
- manual: true
- binaryMode: database

### pruning

- enabled: true
- maxAge: 168 hours
- maxCount: 10000 executions

Thankyou for the details, have you checked and ensured that all these services are on the same VPC? And as i can find that people are having issues with external runners in the latest versions, downgrading to v2.1.0 might help. Let me know what works.

We were reviewing and indeed all services are within the same VPC. For now, we are continuing to run tests with intermediate versions of 2.x.x. However, do you perhaps have any reference for the recommended environment variables to run n8n with an architecture of: 1 master service, n worker services, and n webhook services (with external tasj runners)?

@JavierOrjNeq I have gone through the official documentation about the ENV variables and i can recommend these:

# Common (main, workers, webhooks)
DB_TYPE=postgresdb
DB_POSTGRESDB_HOST=...
DB_POSTGRESDB_PORT=5432
DB_POSTGRESDB_DATABASE=...
DB_POSTGRESDB_USER=...
DB_POSTGRESDB_PASSWORD=...

EXECUTIONS_MODE=queue
QUEUE_BULL_REDIS_HOST=...
QUEUE_BULL_REDIS_PORT=6379
QUEUE_BULL_REDIS_DB=0
QUEUE_BULL_REDIS_PASSWORD=...

N8N_ENCRYPTION_KEY=...

# Main (“master”) service
N8N_HOST=main.your-domain.com
N8N_PORT=5678
N8N_PROTOCOL=https
WEBHOOK_URL=https://webhook.your-domain.com
N8N_EDITOR_BASE_URL=https://main.your-domain.com
N8N_PROXY_HOPS=1

OFFLOAD_MANUAL_EXECUTIONS_TO_WORKERS=true

N8N_RUNNERS_ENABLED=true
N8N_RUNNERS_MODE=external
N8N_RUNNERS_BROKER_LISTEN_ADDRESS=0.0.0.0
N8N_RUNNERS_BROKER_PORT=5679
N8N_RUNNERS_AUTH_TOKEN=your-secure-shared-secret
N8N_NATIVE_PYTHON_RUNNER=true

N8N_DISABLE_PRODUCTION_MAIN_PROCESS=true

# Worker services
# (plus the common DB/Redis/encryption vars above)
N8N_DISABLE_PRODUCTION_MAIN_PROCESS=true
OFFLOAD_MANUAL_EXECUTIONS_TO_WORKERS=true

N8N_RUNNERS_ENABLED=true
N8N_RUNNERS_MODE=external
N8N_RUNNERS_BROKER_LISTEN_ADDRESS=0.0.0.0
N8N_RUNNERS_AUTH_TOKEN=your-secure-shared-secret

# Webhook services
# (plus the common DB/Redis/encryption vars above)
N8N_HOST=webhook.internal.host
N8N_PORT=5678
N8N_PROTOCOL=https
WEBHOOK_URL=https://webhook.your-domain.com
N8N_ENDPOINT_WEBHOOK=webhook

N8N_RUNNERS_ENABLED=true
N8N_RUNNERS_MODE=external
N8N_RUNNERS_BROKER_LISTEN_ADDRESS=0.0.0.0
N8N_RUNNERS_AUTH_TOKEN=your-secure-shared-secret

# External task runners (n8nio/runners)
N8N_RUNNERS_TASK_BROKER_URI=http://n8n-main-or-worker:5679
N8N_RUNNERS_AUTH_TOKEN=your-secure-shared-secret
N8N_RUNNERS_AUTO_SHUTDOWN_TIMEOUT=15
N8N_RUNNERS_MAX_CONCURRENCY=5

Hi @Anshul_Namdev, thank you for the information shared.

I was making changes to the environment variables to leave it exactly as you shared with me, but the error still persists. I did a downgrade to version 2.2.0 (since you suggested I try version 2.1.0, but I see that in 2.2.0 an adjustment was made to the Redis configuration with ElastiCache → feat(core): Add options necessary for AWS elasticache cluster with TLS by mfsiega · Pull Request #23274 · n8n-io/n8n · GitHub)

Main service:

Worker service:

Healthcheck:

N8N Metrics:

# HELP n8n_process_cpu_user_seconds_total Total user CPU time spent in seconds.
# TYPE n8n_process_cpu_user_seconds_total counter
n8n_process_cpu_user_seconds_total 31.790196

# HELP n8n_process_cpu_system_seconds_total Total system CPU time spent in seconds.
# TYPE n8n_process_cpu_system_seconds_total counter
n8n_process_cpu_system_seconds_total 6.520008

# HELP n8n_process_cpu_seconds_total Total user and system CPU time spent in seconds.
# TYPE n8n_process_cpu_seconds_total counter
n8n_process_cpu_seconds_total 38.310204

# HELP n8n_process_start_time_seconds Start time of the process since unix epoch in seconds.
# TYPE n8n_process_start_time_seconds gauge
n8n_process_start_time_seconds 1770732551

# HELP n8n_process_resident_memory_bytes Resident memory size in bytes.
# TYPE n8n_process_resident_memory_bytes gauge
n8n_process_resident_memory_bytes 312778752

# HELP n8n_process_virtual_memory_bytes Virtual memory size in bytes.
# TYPE n8n_process_virtual_memory_bytes gauge
n8n_process_virtual_memory_bytes 33737887744

# HELP n8n_process_heap_bytes Process heap size in bytes.
# TYPE n8n_process_heap_bytes gauge
n8n_process_heap_bytes 364195840

# HELP n8n_process_open_fds Number of open file descriptors.
# TYPE n8n_process_open_fds gauge
n8n_process_open_fds 31

# HELP n8n_process_max_fds Maximum number of open file descriptors.
# TYPE n8n_process_max_fds gauge
n8n_process_max_fds 65535

# HELP n8n_nodejs_eventloop_lag_seconds Lag of event loop in seconds.
# TYPE n8n_nodejs_eventloop_lag_seconds gauge
n8n_nodejs_eventloop_lag_seconds 0

# HELP n8n_nodejs_eventloop_lag_min_seconds The minimum recorded event loop delay.
# TYPE n8n_nodejs_eventloop_lag_min_seconds gauge
n8n_nodejs_eventloop_lag_min_seconds 0.006356992

# HELP n8n_nodejs_eventloop_lag_max_seconds The maximum recorded event loop delay.
# TYPE n8n_nodejs_eventloop_lag_max_seconds gauge
n8n_nodejs_eventloop_lag_max_seconds 1.509949439

# HELP n8n_nodejs_eventloop_lag_mean_seconds The mean of the recorded event loop delays.
# TYPE n8n_nodejs_eventloop_lag_mean_seconds gauge
n8n_nodejs_eventloop_lag_mean_seconds 0.010157601223115473

# HELP n8n_nodejs_eventloop_lag_stddev_seconds The standard deviation of the recorded event loop delays.
# TYPE n8n_nodejs_eventloop_lag_stddev_seconds gauge
n8n_nodejs_eventloop_lag_stddev_seconds 0.0031436888360926356

# HELP n8n_nodejs_eventloop_lag_p50_seconds The 50th percentile of the recorded event loop delays.
# TYPE n8n_nodejs_eventloop_lag_p50_seconds gauge
n8n_nodejs_eventloop_lag_p50_seconds 0.010125311

# HELP n8n_nodejs_eventloop_lag_p90_seconds The 90th percentile of the recorded event loop delays.
# TYPE n8n_nodejs_eventloop_lag_p90_seconds gauge
n8n_nodejs_eventloop_lag_p90_seconds 0.010149887

# HELP n8n_nodejs_eventloop_lag_p99_seconds The 99th percentile of the recorded event loop delays.
# TYPE n8n_nodejs_eventloop_lag_p99_seconds gauge
n8n_nodejs_eventloop_lag_p99_seconds 0.010412031

# HELP n8n_nodejs_active_resources Number of active resources that are currently keeping the event loop alive, grouped by async resource type.
# TYPE n8n_nodejs_active_resources gauge
n8n_nodejs_active_resources{type="PipeWrap"} 2
n8n_nodejs_active_resources{type="TCPServerWrap"} 2
n8n_nodejs_active_resources{type="TCPSocketWrap"} 7
n8n_nodejs_active_resources{type="Timeout"} 21
n8n_nodejs_active_resources{type="Immediate"} 1

# HELP n8n_nodejs_active_resources_total Total number of active resources.
# TYPE n8n_nodejs_active_resources_total gauge
n8n_nodejs_active_resources_total 33

# HELP n8n_nodejs_active_handles Number of active libuv handles grouped by handle type. Every handle type is C++ class name.
# TYPE n8n_nodejs_active_handles gauge
n8n_nodejs_active_handles{type="Socket"} 4
n8n_nodejs_active_handles{type="Server"} 2
n8n_nodejs_active_handles{type="TLSSocket"} 5

# HELP n8n_nodejs_active_handles_total Total number of active handles.
# TYPE n8n_nodejs_active_handles_total gauge
n8n_nodejs_active_handles_total 11

# HELP n8n_nodejs_active_requests Number of active libuv requests grouped by request type. Every request type is C++ class name.
# TYPE n8n_nodejs_active_requests gauge

# HELP n8n_nodejs_active_requests_total Total number of active requests.
# TYPE n8n_nodejs_active_requests_total gauge
n8n_nodejs_active_requests_total 0

# HELP n8n_nodejs_heap_size_total_bytes Process heap size from Node.js in bytes.
# TYPE n8n_nodejs_heap_size_total_bytes gauge
n8n_nodejs_heap_size_total_bytes 185077760

# HELP n8n_nodejs_heap_size_used_bytes Process heap size used from Node.js in bytes.
# TYPE n8n_nodejs_heap_size_used_bytes gauge
n8n_nodejs_heap_size_used_bytes 166642504

# HELP n8n_nodejs_external_memory_bytes Node.js external memory size in bytes.
# TYPE n8n_nodejs_external_memory_bytes gauge
n8n_nodejs_external_memory_bytes 21546968

# HELP n8n_nodejs_heap_space_size_total_bytes Process heap space size total from Node.js in bytes.
# TYPE n8n_nodejs_heap_space_size_total_bytes gauge
n8n_nodejs_heap_space_size_total_bytes{space="read_only"} 0
n8n_nodejs_heap_space_size_total_bytes{space="new"} 5767168
n8n_nodejs_heap_space_size_total_bytes{space="old"} 154976256
n8n_nodejs_heap_space_size_total_bytes{space="code"} 8650752
n8n_nodejs_heap_space_size_total_bytes{space="shared"} 0
n8n_nodejs_heap_space_size_total_bytes{space="trusted"} 5812224
n8n_nodejs_heap_space_size_total_bytes{space="new_large_object"} 0
n8n_nodejs_heap_space_size_total_bytes{space="large_object"} 9543680
n8n_nodejs_heap_space_size_total_bytes{space="code_large_object"} 327680
n8n_nodejs_heap_space_size_total_bytes{space="shared_large_object"} 0
n8n_nodejs_heap_space_size_total_bytes{space="trusted_large_object"} 0

# HELP n8n_nodejs_heap_space_size_used_bytes Process heap space size used from Node.js in bytes.
# TYPE n8n_nodejs_heap_space_size_used_bytes gauge
n8n_nodejs_heap_space_size_used_bytes{space="read_only"} 0
n8n_nodejs_heap_space_size_used_bytes{space="new"} 244912
n8n_nodejs_heap_space_size_used_bytes{space="old"} 144154104
n8n_nodejs_heap_space_size_used_bytes{space="code"} 7546752
n8n_nodejs_heap_space_size_used_bytes{space="shared"} 0
n8n_nodejs_heap_space_size_used_bytes{space="trusted"} 5078296
n8n_nodejs_heap_space_size_used_bytes{space="new_large_object"} 0
n8n_nodejs_heap_space_size_used_bytes{space="large_object"} 9337040
n8n_nodejs_heap_space_size_used_bytes{space="code_large_object"} 290944
n8n_nodejs_heap_space_size_used_bytes{space="shared_large_object"} 0
n8n_nodejs_heap_space_size_used_bytes{space="trusted_large_object"} 0

# HELP n8n_nodejs_heap_space_size_available_bytes Process heap space size available from Node.js in bytes.
# TYPE n8n_nodejs_heap_space_size_available_bytes gauge
n8n_nodejs_heap_space_size_available_bytes{space="read_only"} 0
n8n_nodejs_heap_space_size_available_bytes{space="new"} 2590096
n8n_nodejs_heap_space_size_available_bytes{space="old"} 7773992
n8n_nodejs_heap_space_size_available_bytes{space="code"} 562272
n8n_nodejs_heap_space_size_available_bytes{space="shared"} 0
n8n_nodejs_heap_space_size_available_bytes{space="trusted"} 629744
n8n_nodejs_heap_space_size_available_bytes{space="new_large_object"} 2883584
n8n_nodejs_heap_space_size_available_bytes{space="large_object"} 0
n8n_nodejs_heap_space_size_available_bytes{space="code_large_object"} 0
n8n_nodejs_heap_space_size_available_bytes{space="shared_large_object"} 0
n8n_nodejs_heap_space_size_available_bytes{space="trusted_large_object"} 0

# HELP n8n_nodejs_version_info Node.js version info.
# TYPE n8n_nodejs_version_info gauge
n8n_nodejs_version_info{version="v22.21.1",major="22",minor="21",patch="1"} 1

# HELP n8n_nodejs_gc_duration_seconds Garbage collection duration by kind, one of major, minor, incremental or weakcb.
# TYPE n8n_nodejs_gc_duration_seconds histogram
n8n_nodejs_gc_duration_seconds_bucket{le="0.001",kind="minor"} 129
n8n_nodejs_gc_duration_seconds_bucket{le="0.01",kind="minor"} 242
n8n_nodejs_gc_duration_seconds_bucket{le="0.1",kind="minor"} 252
n8n_nodejs_gc_duration_seconds_bucket{le="1",kind="minor"} 252
n8n_nodejs_gc_duration_seconds_bucket{le="2",kind="minor"} 252
n8n_nodejs_gc_duration_seconds_bucket{le="5",kind="minor"} 252
n8n_nodejs_gc_duration_seconds_bucket{le="+Inf",kind="minor"} 252
n8n_nodejs_gc_duration_seconds_sum{kind="minor"} 0.8828619220008549
n8n_nodejs_gc_duration_seconds_count{kind="minor"} 252
n8n_nodejs_gc_duration_seconds_bucket{le="0.001",kind="incremental"} 2
n8n_nodejs_gc_duration_seconds_bucket{le="0.01",kind="incremental"} 6
n8n_nodejs_gc_duration_seconds_bucket{le="0.1",kind="incremental"} 10
n8n_nodejs_gc_duration_seconds_bucket{le="1",kind="incremental"} 10
n8n_nodejs_gc_duration_seconds_bucket{le="2",kind="incremental"} 10
n8n_nodejs_gc_duration_seconds_bucket{le="5",kind="incremental"} 10
n8n_nodejs_gc_duration_seconds_bucket{le="+Inf",kind="incremental"} 10
n8n_nodejs_gc_duration_seconds_sum{kind="incremental"} 0.1996369390001928
n8n_nodejs_gc_duration_seconds_count{kind="incremental"} 10
n8n_nodejs_gc_duration_seconds_bucket{le="0.001",kind="major"} 0
n8n_nodejs_gc_duration_seconds_bucket{le="0.01",kind="major"} 1
n8n_nodejs_gc_duration_seconds_bucket{le="0.1",kind="major"} 6
n8n_nodejs_gc_duration_seconds_bucket{le="1",kind="major"} 10
n8n_nodejs_gc_duration_seconds_bucket{le="2",kind="major"} 10
n8n_nodejs_gc_duration_seconds_bucket{le="5",kind="major"} 10
n8n_nodejs_gc_duration_seconds_bucket{le="+Inf",kind="major"} 10
n8n_nodejs_gc_duration_seconds_sum{kind="major"} 1.0034719430003607
n8n_nodejs_gc_duration_seconds_count{kind="major"} 10

# HELP n8n_version_info n8n version info.
# TYPE n8n_version_info gauge
n8n_version_info{version="v2.2.0",major="2",minor="2",patch="0"} 1

# HELP n8n_instance_role_leader Whether this main instance is the leader (1) or not (0).
# TYPE n8n_instance_role_leader gauge
n8n_instance_role_leader 1

# HELP n8n_scaling_mode_queue_jobs_waiting Current number of enqueued jobs waiting for pickup in scaling mode.
# TYPE n8n_scaling_mode_queue_jobs_waiting gauge
n8n_scaling_mode_queue_jobs_waiting 11

# HELP n8n_scaling_mode_queue_jobs_active Current number of jobs being processed across all workers in scaling mode.
# TYPE n8n_scaling_mode_queue_jobs_active gauge
n8n_scaling_mode_queue_jobs_active 0

# HELP n8n_scaling_mode_queue_jobs_completed Total number of jobs completed across all workers in scaling mode since instance start.
# TYPE n8n_scaling_mode_queue_jobs_completed counter
n8n_scaling_mode_queue_jobs_completed 0

# HELP n8n_scaling_mode_queue_jobs_failed Total number of jobs failed across all workers in scaling mode since instance start.
# TYPE n8n_scaling_mode_queue_jobs_failed counter
n8n_scaling_mode_queue_jobs_failed 0

# HELP n8n_active_workflow_count Total number of active workflows.
# TYPE n8n_active_workflow_count gauge
n8n_active_workflow_count 0

Hi @Anshul_Namdev, I thank you in advance for all the support provided with this error. I want to tell you that the root cause of the problem was actually a bad configuration of the custom image I had in Docker, but once I fixed it, it worked without any problem.

2 Likes

I am happy you figured this out! Docker setup for a non technical person can be a nightmare of errors if not configured correctly. Cheers!

This topic was automatically closed 7 days after the last reply. New replies are no longer allowed.