Hey all,
I’m experiencing a critical issue with my n8n instance hosted on Elest.io . My workflows are getting stuck in “queued” status, making the entire system unusable for production.
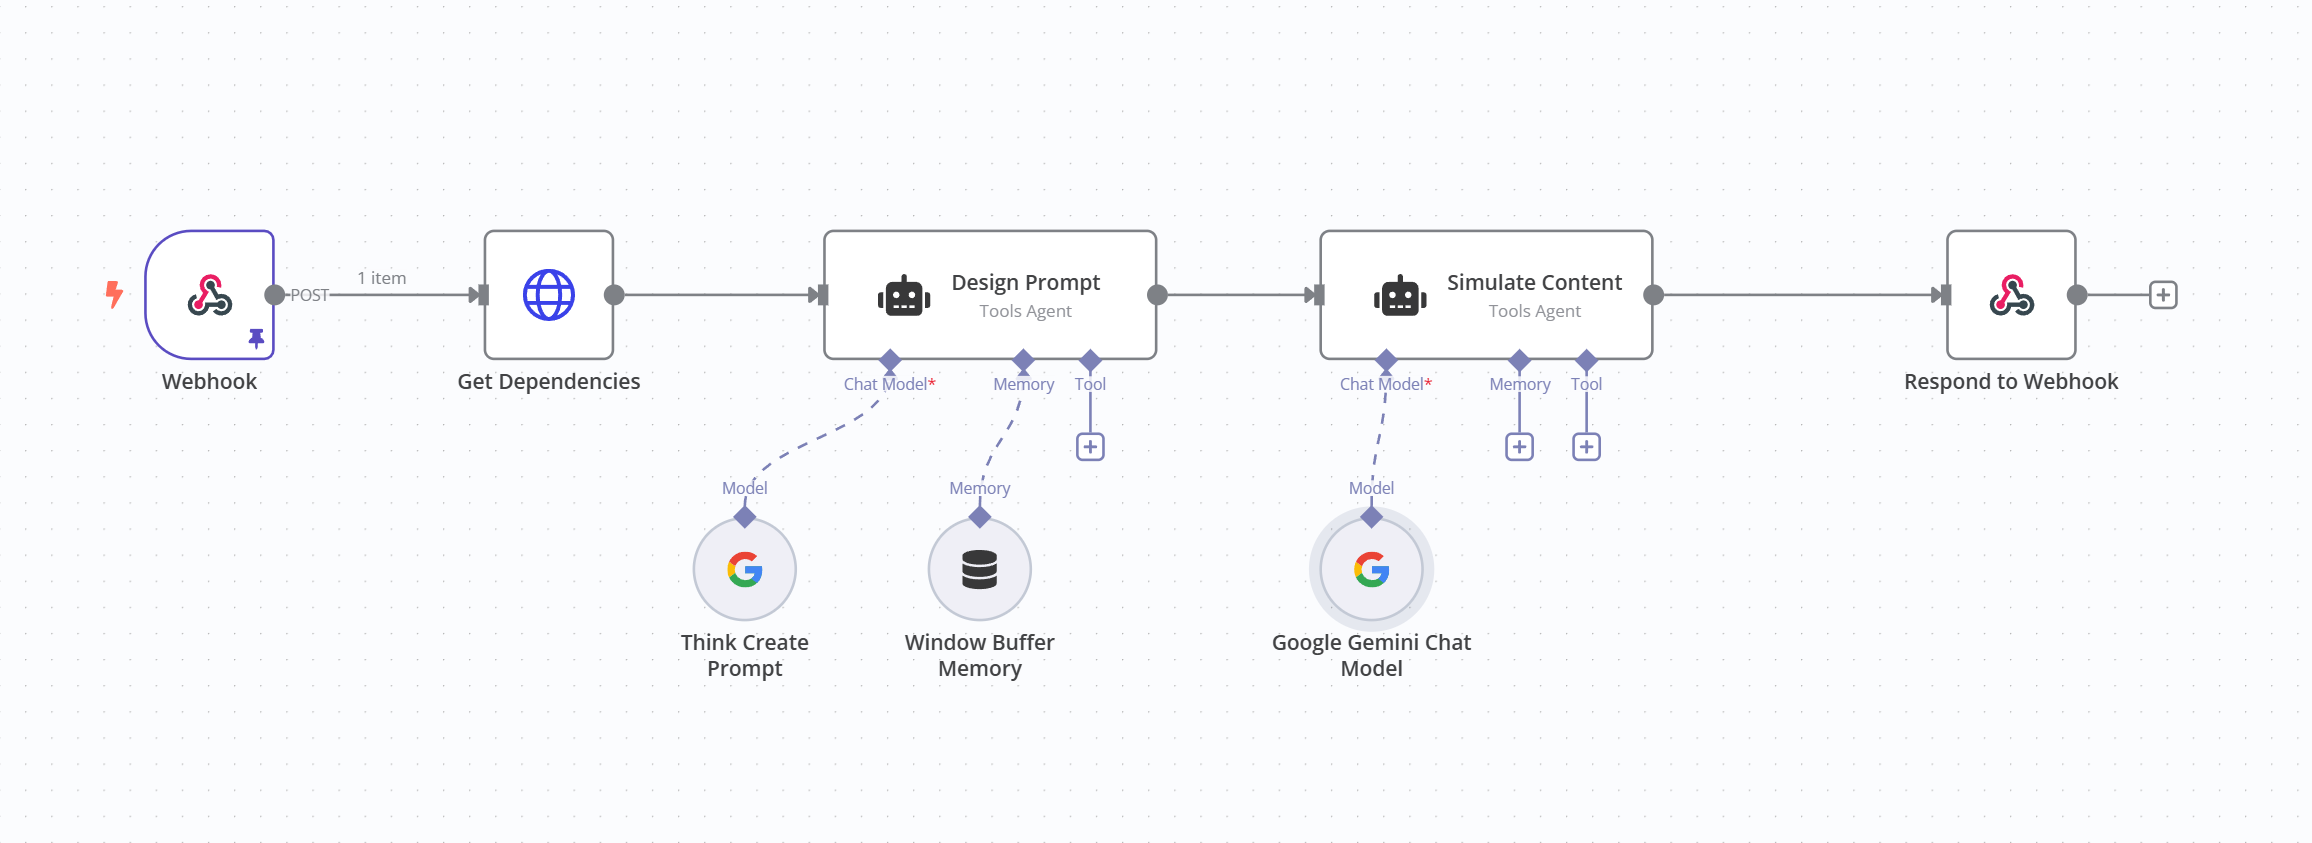
My workflow looks like this:
When executed:
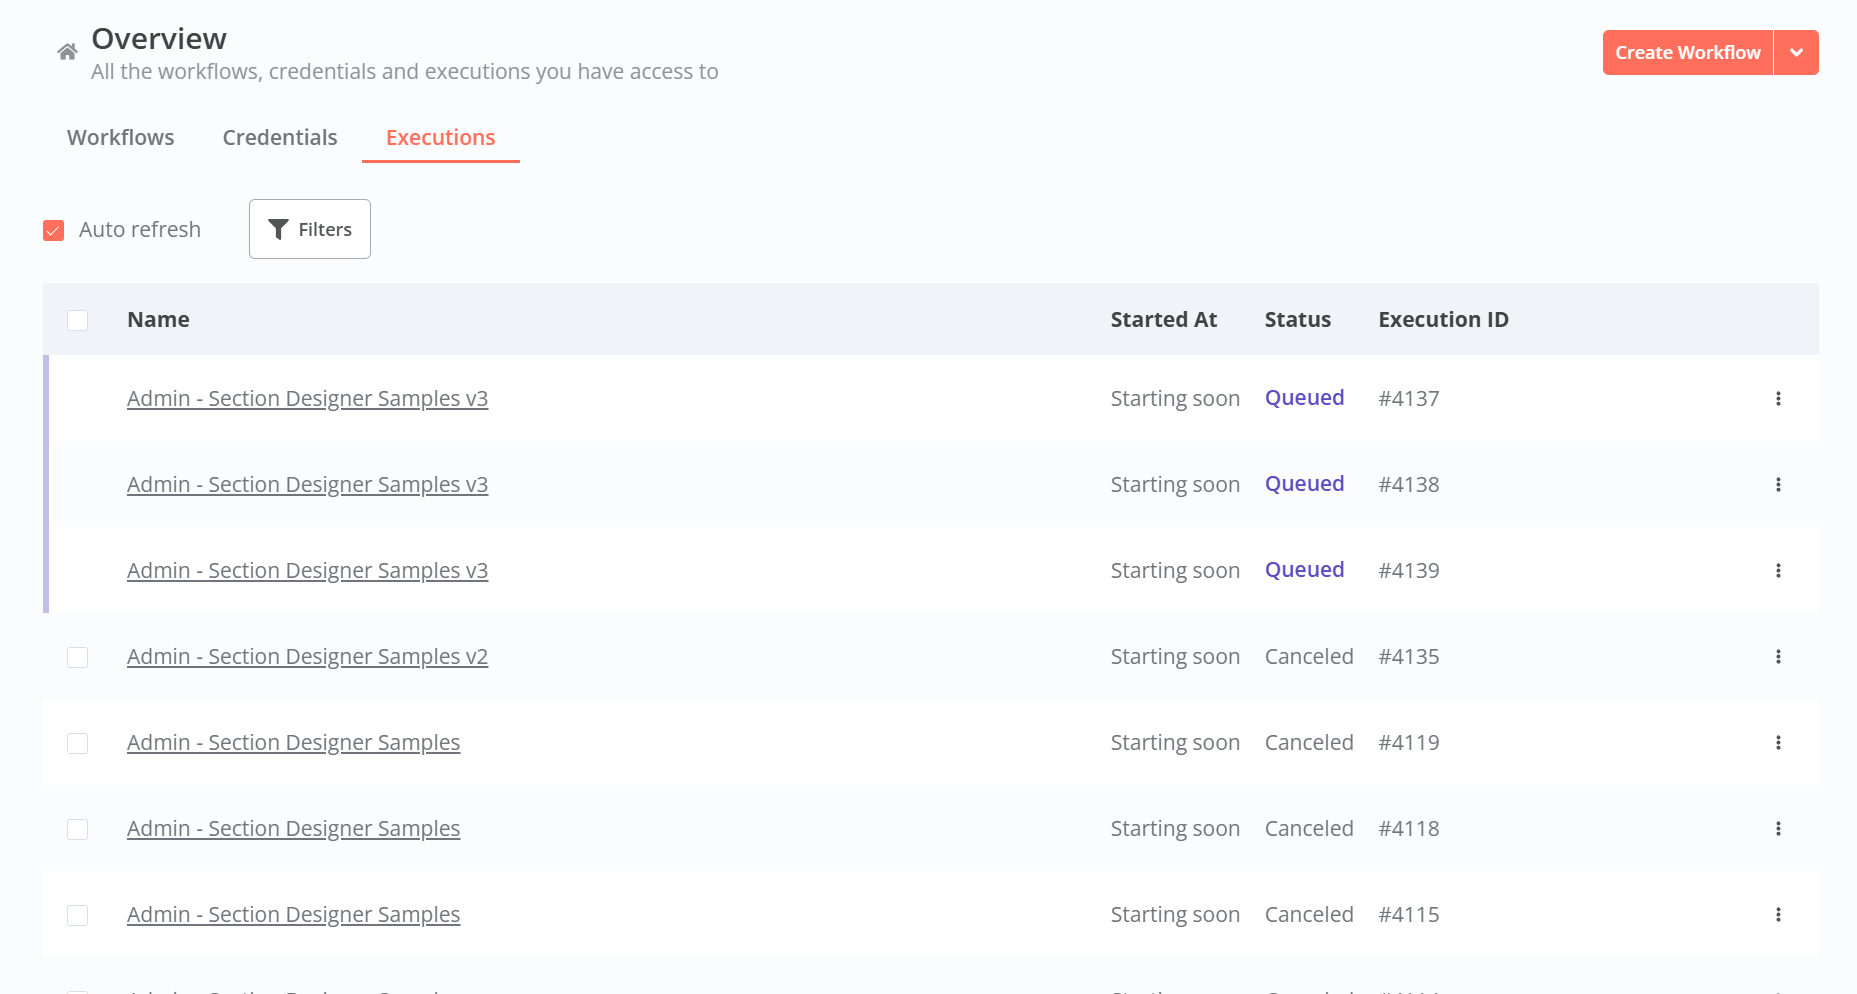
It starts normally
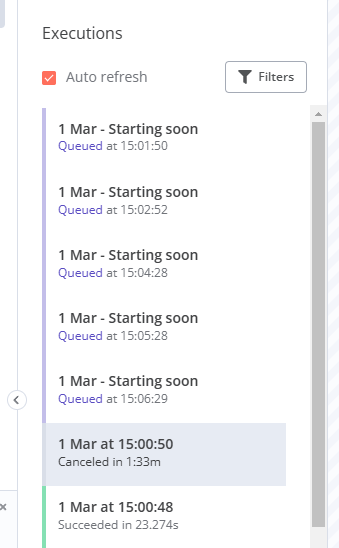
After approximately 60 seconds of execution time, it transitions to “queued” status
New executions immediately show as “queued” without even starting
In logs, I see: Error with Webhook-Response for execution "XXXX": "The execution was cancelled"
n8n version: 1.80.4
Running in queue mode with one main and one worker
PostgreSQL 15 database
Redis for queue management
Docker Compose setup
The only way I’ve been able to temporarily fix this is by:
Duplicating the affected workflow
Setting a new webhook URL
Deleting the original workflow (which removes those queued executions)
Activating the new workflow
This works for a while, but the issue inevitably returns.
After extensive research, I found these potentially related issues:
Upgrading server RAM and CPU resources
Implementing Redis flushing on restart
Setting longer timeouts in docker-compose (N8N_WEBHOOKS_TIMEOUT: 75000)
Configuring task runners (N8N_RUNNERS_ENABLED: “true”)
Adjusting queue settings (QUEUE_PROCESS_TIMEOUT: 420000)
Explicitly setting the Redis DB number
version: "3.8"

volumes:
  db_data:
  n8n:
  redis_data:

x-shared: &shared
  restart: always
  image: n8nio/n8n:${SOFTWARE_VERSION_TAG}
  environment:
    DB_TYPE: postgresdb
    DB_POSTGRESDB_HOST: postgres
    DB_POSTGRESDB_PORT: 5432
    DB_POSTGRESDB_DATABASE: ${POSTGRES_DB}
    DB_POSTGRESDB_USER: ${POSTGRES_USER}
    DB_POSTGRESDB_PASSWORD: ${SOFTWARE_PASSWORD}
    EXECUTIONS_MODE: queue
    QUEUE_BULL_REDIS_HOST: redis
    QUEUE_BULL_REDIS_DB: 0
    QUEUE_HEALTH_CHECK_ACTIVE: "true"
    QUEUE_PROCESS_TIMEOUT: 420000
    N8N_QUEUE_BULL_CONCURRENCY: 10
    N8N_WEBHOOKS_TIMEOUT: 75000
    WEBHOOK_TUNNEL_URL: https://${DOMAIN}
    WEBHOOK_URL: https://${DOMAIN}
    N8N_BASIC_AUTH_ACTIVE: "true"
    N8N_BASIC_AUTH_USER: ${N8N_BASIC_AUTH_USER}
    N8N_BASIC_AUTH_PASSWORD: ${SOFTWARE_PASSWORD}
    N8N_HOST: ${DOMAIN}
    N8N_EMAIL_MODE: "smtp"
    N8N_SMTP_HOST: ${SMTP_HOST}
    N8N_SMTP_PORT: ${SMTP_PORT}
    N8N_SMTP_USER: " "
    N8N_SMTP_PASS: " "
    N8N_SMTP_SENDER: ${SMTP_FROM_EMAIL}
    N8N_SMTP_SSL: "false"
    NODE_TLS_REJECT_UNAUTHORIZED: 0
    EXECUTIONS_DATA_PRUNE: ${EXECUTIONS_DATA_PRUNE}
    EXECUTIONS_DATA_MAX_AGE: ${EXECUTIONS_DATA_MAX_AGE}
    N8N_ENCRYPTION_KEY: ${N8N_ENCRYPTION_KEY}
    N8N_DEFAULT_BINARY_DATA_MODE: filesystem
    N8N_PAYLOAD_SIZE_MAX: 32
    N8N_RUNNERS_ENABLED: "true"
    N8N_RUNNERS_MODE: "internal"
My logs show executions being cancelled immediately after queueing:
app-n8n-1: Enqueued execution 4122 (job 1580)
app-n8n-1: Error with Webhook-Response for execution "4122": "The execution was cancelled"
app-n8n-1: The execution was cancelled
app-n8n-1: The execution was cancelled
Any help from the community would be greatly appreciated. I’m happy to provide additional information, join a call, or work with anyone who has experienced something similar.
Thank you!
n8n
February 28, 2025, 3:40am
2
It looks like your topic is missing some important information. Could you provide the following if applicable.
n8n version: Database (default: SQLite): n8n EXECUTIONS_PROCESS setting (default: own, main): Running n8n via (Docker, npm, n8n cloud, desktop app): Operating system:
Are you consistently seeing this issue after exactly 60 seconds, or does the timing vary?
Have you monitored resource usage (CPU, memory, disk I/O) during these executions?
Are there any specific nodes in your workflow that might be resource-intensive or prone to timeouts?
(There is a huge possiblity that resourse you are hosting is not enough, can i get your server config)
Hey @Yo_its_prakash
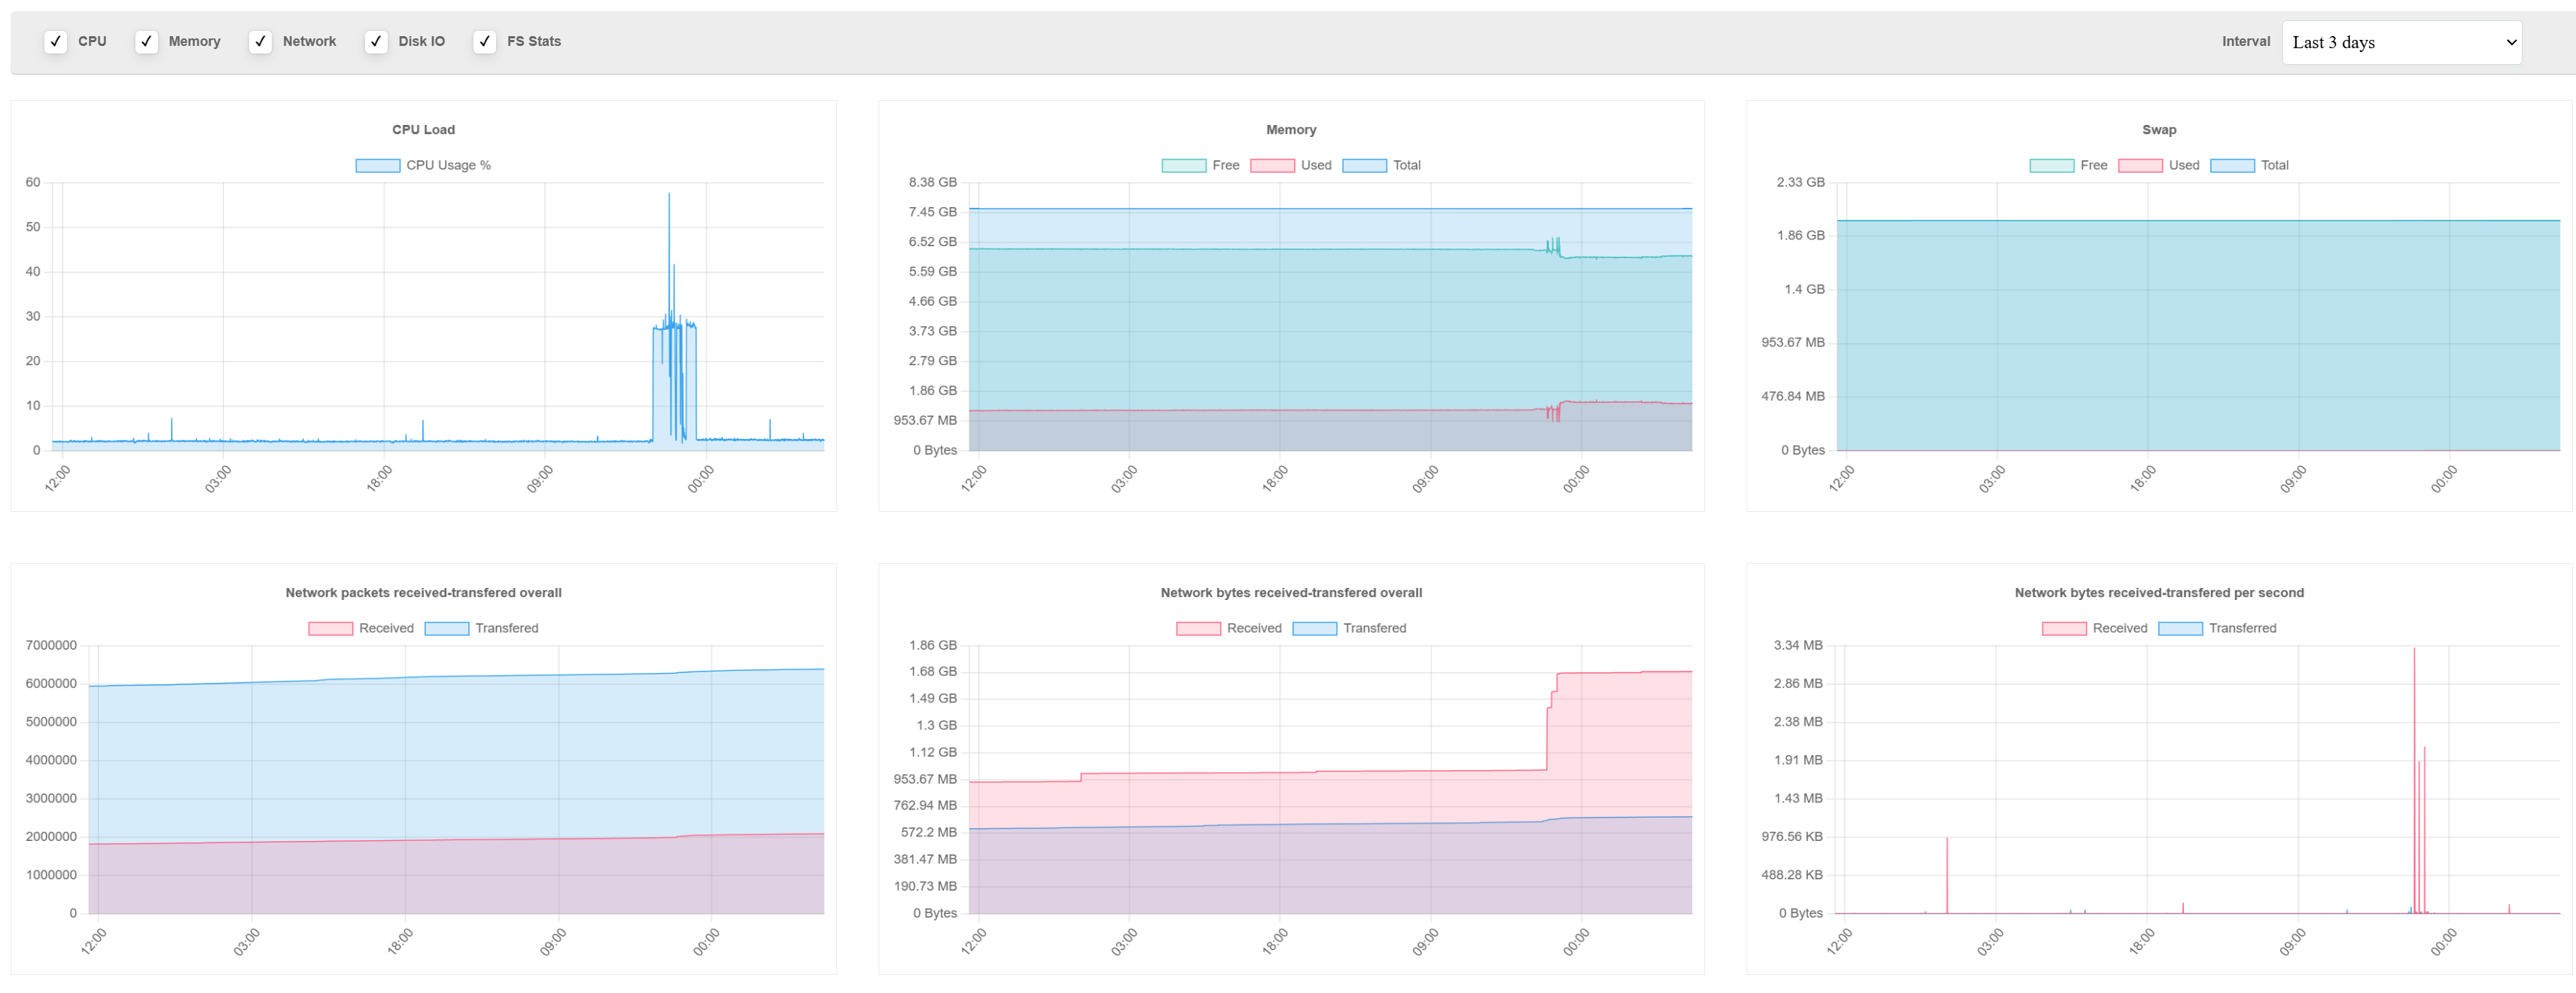
Server Config
LARGE-4C-8G (4 VCPU s - 8 GB RAM - 40 GB storage) Provider: hetzner
Server Stats (last 3 days)
Does anyone from the forum or n8n support team have any ideas?
Do you have valid https connection with SSL cert? If you don’t, webhooks will have problems.
Hey @Daniel_Lamphere
Yes I do, everything was working fine for many days. Then one day it just started doing this.
Additional information i noticed these errors
Logs
app-n8n-1         | Editor is now accessible via:
app-n8n-1         | https://n8n-inscope-u20621.vm.elestio.app
app-n8n-worker-1  | Worker errored while running execution 4121 (job 1579)
app-n8n-worker-1  | Worker failed to find data for execution 4121 (job 1579) (execution 4121)
app-n8n-1         | Execution 4121 (job 1579) failed
app-n8n-1         | Error: Worker failed to find data for execution 4121 (job 1579)
app-n8n-1         |     at JobProcessor.processJob (/usr/local/lib/node_modules/n8n/dist/scaling/job-processor.js:78:19)
app-n8n-1         |     at processTicksAndRejections (node:internal/process/task_queues:95:5)
app-n8n-1         |     at Queue.<anonymous> (/usr/local/lib/node_modules/n8n/dist/scaling/scaling.service.js:115:17)
app-n8n-1         |
app-n8n-1         | Enqueued execution 4147 (job 1581)
app-n8n-worker-1  | Worker started execution 4147 (job 1581)
app-n8n-worker-1  | (node:7) Warning: Setting the NODE_TLS_REJECT_UNAUTHORIZED environment variable to '0' makes TLS connections and HTTPS requests insecure by disabling certificate verification.
app-n8n-worker-1  | (Use `node --trace-warnings ...` to show where the warning was created)
app-n8n-1         | Execution 4147 (job 1581) finished successfully
app-n8n-worker-1  | Worker finished execution 4147 (job 1581)
app-n8n-1         | Enqueued execution 4148 (job 1582)
app-n8n-worker-1  | Worker started execution 4148 (job 1582)
app-n8n-1         | Enqueued execution 4149 (job 1583)
app-n8n-worker-1  | Worker started execution 4149 (job 1583)
app-n8n-worker-1  | Worker finished execution 4148 (job 1582)
app-n8n-1         | Execution 4148 (job 1582) finished successfully
db                | 2025-03-01 20:01:20.429 UTC [27] LOG:  checkpoint starting: time
cache             | 1:M 01 Mar 2025 20:01:21.022 * 100 changes in 300 seconds. Saving...
cache             | 1:M 01 Mar 2025 20:01:21.023 * Background saving started by pid 373
cache             | 373:C 01 Mar 2025 20:01:21.029 * DB saved on disk
cache             | 373:C 01 Mar 2025 20:01:21.030 * Fork CoW for RDB: current 0 MB, peak 0 MB, average 0 MB
cache             | 1:M 01 Mar 2025 20:01:21.125 * Background saving terminated with success
db                | 2025-03-01 20:01:23.559 UTC [27] LOG:  checkpoint complete: wrote 32 buffers (0.2%); 0 WAL file(s) added, 0 removed, 0 recycled; write=3.118 s, sync=0.005 s, total=3.130 s; sync files=16, longest=0.002 s, average=0.001 s; distance=140 kB, estimate=140 kB
app-n8n-1         | Enqueued execution 4150 (job 1584)
app-n8n-1         | Error with Webhook-Response for execution "4149": "The execution was cancelled"
app-n8n-1         | The execution was cancelled
app-n8n-1         | The execution was cancelled
app-n8n-1         | Enqueued execution 4151 (job 1585)
app-n8n-1         | Enqueued execution 4152 (job 1586)
app-n8n-1         | Enqueued execution 4153 (job 1587)
db                | 2025-03-01 20:06:20.638 UTC [27] LOG:  checkpoint starting: time
db                | 2025-03-01 20:06:23.283 UTC [27] LOG:  checkpoint complete: wrote 27 buffers (0.2%); 0 WAL file(s) added, 0 removed, 0 recycled; write=2.629 s, sync=0.006 s, total=2.645 s; sync files=15, longest=0.003 s, average=0.001 s; distance=78 kB, estimate=134 kB
app-n8n-1         | Enqueued execution 4154 (job 1588)
After so many hours spent looking at this and trying to debug the issue the only thing that helped is switching from queue mode to regular mode.
This is not an ideal solution, but I really don’t know what else I can do.
@AliFarahat Did you figure out what was happening? I’m experiencing the same issue and have applied the same workaround, but I’m concerned this might pose a problem in the future.
Hey @Vitor_Fachini ,
No idea, I have spent so much time on this. I even tried going with the official hosted n8n version and I still faced the same issue with my workflows.
We need some official support. I sent them an email sometime back and still did not get a response
ria
March 19, 2025, 1:35pm
12
Hi @AliFarahat hiring btw)
Having had a look at your issue, it sounds to me like a problem with your Respond to Webhook node and the execution cannot finish because of it, which then queues up any other executions being triggered.
Tip for sharing your workflow in the forum
Ensure to copy your n8n workflow and paste it in the code block , that is in between the pairs of triple backticks, which also could be achieved by clicking </> (preformatted text) in the editor and pasting in your workflow.
```
Make sure that you’ve removed any sensitive information from your workflow and include dummy data or pinned data as much as you can!
Thanks
netroy
March 19, 2025, 1:46pm
13
This line implies that there is an unhandled error. do you see any other errors just before that line?
Hello @ria and @netroy ,
thanks for joining the convo. Let me provide more context and share some workflows in this post.
The issue is not confined to one workflow, it is effecting every workflow that runs past the 60s execution mark. It also effects executions in regular or queue mode.
When running in regular causes the service to crash and I have to manually restart it.
When running in queue mode the server starts adding new queued executions every few seconds.
The error is intermittent, it effects probably 1 of 10 executions (and only if they take longer than 60 secs.
Please are some workflows where I faced errors
1. Original Workflow: This workflow only responds to the webhook after all nodes have executed.
I can’t attach other workflows. The number of chars is greater than the limit for the forum
In the the other workflows the webhook is responded to immediately then the AI generated content is delivered via webhook by an HTTP node.
Happy to share the other nodes, but dont know how…
Sorry for reply to an old thread . I’m facing exact same issue and need help. Please advise what I am doing wrong.
n8n works fine in regular mode.
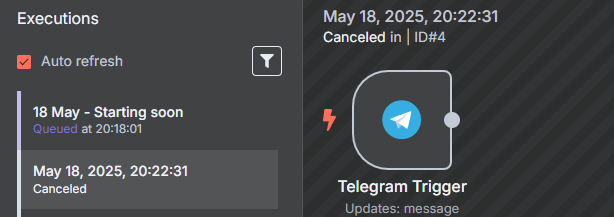
in queue mode
– all executions ( right from launch ) get added to queue .
– Doesn’t matter if it is test run or active
Workflow I tried
Telegram Trigger
– Single node workflow
– upon running, for each message from telegram, one item gets added to the queue
Below is my docker-compose
# hard-dependency on core-services stack

volumes:
  n8n_data:
    name: n8n_data
  n8n_webhook:
    name: n8n_webhook
  n8n_worker:
    name: n8n_worker
  redis_data:
    name: redis_data
  postgres_data:
    name: postgres_data

networks:
  backend:
    external: true
    name: backend

# Common environment variables for all n8n-related services
x-n8n-env: &n8n-env
  N8N_PORT: ${N8N_PORT}
  N8N_SECURE_COOKIE: ${N8N_SECURE_COOKIE}
  N8N_DIAGNOSTICS_ENABLED: ${N8N_DIAGNOSTICS_ENABLED}
  NODE_FUNCTION_ALLOW_EXTERNAL: ${NODE_FUNCTION_ALLOW_EXTERNAL}
  GENERIC_TIMEZONE: ${GENERIC_TIMEZONE}
  N8N_ENCRYPTION_KEY: ${N8N_ENCRYPTION_KEY}
  N8N_USER_FOLDER: ${N8N_USER_FOLDER}
  N8N_ENFORCE_SETTINGS_FILE_PERMISSIONS: ${N8N_ENFORCE_SETTINGS_FILE_PERMISSIONS}
  WEBHOOK_URL: ${WEBHOOK_URL}
  N8N_PROTOCOL: ${N8N_PROTOCOL}
  NODE_ENV: ${NODE_ENV}

  # Queue mode config
  QUEUE_BULL_REDIS_HOST: ${QUEUE_BULL_REDIS_HOST}
  QUEUE_BULL_HEALTH_CHECK_ACTIVE: ${QUEUE_BULL_HEALTH_CHECK_ACTIVE}
  QUEUE_BULL_REDIS_PASSWORD: ${QUEUE_BULL_REDIS_PASSWORD}

  # DB config
  DB_TYPE: ${DB_TYPE}
  DB_TABLE_PREFIX: ${DB_TABLE_PREFIX}
  DB_POSTGRESDB_HOST: ${POSTGRES_HOST}
  DB_POSTGRESDB_PORT: ${POSTGRES_PORT}
  DB_POSTGRESDB_DATABASE: ${POSTGRES_DB}
  DB_POSTGRESDB_USER: ${POSTGRES_USER}
  DB_POSTGRESDB_PASSWORD: ${POSTGRES_PASSWORD}

  # Task runner config
  N8N_RUNNERS_ENABLED: ${N8N_RUNNERS_ENABLED}
  OFFLOAD_MANUAL_EXECUTIONS_TO_WORKERS: ${OFFLOAD_MANUAL_EXECUTIONS_TO_WORKERS}
  N8N_RUNNERS_AUTH_TOKEN: ${N8N_RUNNERS_AUTH_TOKEN}
  N8N_TASK_BROKER_URL: ${N8N_TASK_BROKER_URL}
  N8N_COMMAND_RESPONSE_URL: ${N8N_COMMAND_RESPONSE_URL}
  N8N_TASK_BROKER_PORT: ${N8N_TASK_BROKER_PORT}

x-n8n-common: &n8n-common
  image: n8nio/n8n:latest
  user: root:root
  restart: unless-stopped
  links:
    - postgres
    - redis
  networks:
    - backend
  depends_on: &depends-on-defaults
    redis:
      condition: service_healthy
    postgres:
      condition: service_healthy
  healthcheck:
    test: ["CMD-SHELL", "wget -qO- http://127.0.0.1:5678/health || exit 1 "]
    interval: 5s
    timeout: 5s
    retries: 1
    start_period: 30s

services:
  redis:
    image: redis
    container_name: redis
    restart: unless-stopped
    command: redis-server --save 60 1 --loglevel warning --requirepass ${QUEUE_BULL_REDIS_PASSWORD}
    volumes:
      - redis_data:/data
    ports:
      - "6379:6379"
    networks:
      - backend
    healthcheck:
      test: ['CMD', 'redis-cli', 'ping']
      interval: 1s
      timeout: 3s

  postgres:
    image: postgres
    container_name: postgres
    restart: unless-stopped
    environment:
      - POSTGRES_DB=${POSTGRES_DB}
      - POSTGRES_USER=${POSTGRES_USER}
      - POSTGRES_PASSWORD=${POSTGRES_PASSWORD}
      - PGDATA=${PGDATA}
    volumes:
      - postgres_data:/var/lib/postgresql/data
      - ${SETUP_ROOT_FOLDER}/postgres/init-data.sh:/docker-entrypoint-initdb.d/init-data.sh
    ports:
      - 5432:5432
    networks:
      - backend
    healthcheck:
      test: ['CMD-SHELL', 'pg_isready -h localhost -U ${POSTGRES_USER} -d ${POSTGRES_DB}']
      interval: 10s
      timeout: 10s
      retries: 5
      start_period: 30s

  n8n:
    <<: *n8n-common
    container_name: n8n
    environment:
      <<: *n8n-env
      EXECUTIONS_MODE: ${EXECUTIONS_MODE}
    volumes:
      - n8n_data:${N8N_ROOT_FOLDER}
    ports:
      - "5678:5678"
      - "5679:5679"

  n8n-worker:
    <<: *n8n-common
    container_name: n8n-worker
    command: sh /worker
    environment:
      <<: *n8n-env
      N8N_CONCURRENCY_PRODUCTION_LIMIT: 10
      N8N_GRACEFUL_SHUTDOWN_TIMEOUT: 300
    volumes:
      - n8n_worker:${N8N_ROOT_FOLDER}
    depends_on:
      n8n:
        condition: service_healthy
      <<: *depends-on-defaults

  n8n-webhook:
    <<: *n8n-common
    container_name: n8n-webhook
    command: sh /webhook
    environment:
      <<: *n8n-env
      EXECUTIONS_MODE: queue
    volumes:
      - n8n_webhook:${N8N_ROOT_FOLDER}
    depends_on:
      n8n:
        condition: service_healthy
      <<: *depends-on-defaults
A few questions I have are: Can the main N8n instance communicate with the worker node? Can you see any executions happening in the logs on both nodes? You can also enable debug logs, maybe this will help further.
This should help to understand why and what is happening
2 Likes
Finally working
I did the following
Added following to respective containers
– commands - “worker” and “webhook”
– N8N_RUNNERS_MODE
In case anyone need - my working docker-compose for n8n + 1 worker + 1 webhook + redis + postgres
# hard-dependency on core-services stack

volumes:
  n8n_data:
    name: n8n_data
  n8n_webhook:
    name: n8n_webhook
  n8n_worker:
    name: n8n_worker
  redis_data:
    name: redis_data
  postgres_data:
    name: postgres_data

networks:
  backend:
    external: true
    name: backend

# Common environment variables for all n8n-related services
x-n8n-env: &n8n-env
  N8N_PORT: ${N8N_PORT}
  #N8N_SECURE_COOKIE: ${N8N_SECURE_COOKIE}
  N8N_DIAGNOSTICS_ENABLED: ${N8N_DIAGNOSTICS_ENABLED}
  NODE_FUNCTION_ALLOW_EXTERNAL: ${NODE_FUNCTION_ALLOW_EXTERNAL}
  GENERIC_TIMEZONE: ${GENERIC_TIMEZONE}
  N8N_ENCRYPTION_KEY: ${N8N_ENCRYPTION_KEY}
  N8N_USER_FOLDER: ${N8N_USER_FOLDER}
  N8N_ENFORCE_SETTINGS_FILE_PERMISSIONS: ${N8N_ENFORCE_SETTINGS_FILE_PERMISSIONS}
  WEBHOOK_URL: ${WEBHOOK_URL}
  N8N_PROTOCOL: ${N8N_PROTOCOL}
  NODE_ENV: ${NODE_ENV}

  # Queue mode config
  QUEUE_BULL_REDIS_HOST: ${QUEUE_BULL_REDIS_HOST}
  QUEUE_BULL_HEALTH_CHECK_ACTIVE: ${QUEUE_BULL_HEALTH_CHECK_ACTIVE}
  QUEUE_BULL_REDIS_PASSWORD: ${QUEUE_BULL_REDIS_PASSWORD}
  EXECUTIONS_MODE: ${EXECUTIONS_MODE}

  # DB config
  DB_TYPE: ${DB_TYPE}
  DB_TABLE_PREFIX: ${DB_TABLE_PREFIX}
  DB_POSTGRESDB_HOST: ${POSTGRES_HOST}
  DB_POSTGRESDB_PORT: ${POSTGRES_PORT}
  DB_POSTGRESDB_DATABASE: ${POSTGRES_DB}
  DB_POSTGRESDB_USER: ${POSTGRES_USER}
  DB_POSTGRESDB_PASSWORD: ${POSTGRES_PASSWORD}

  # Task runner config
  N8N_RUNNERS_ENABLED: ${N8N_RUNNERS_ENABLED}
  OFFLOAD_MANUAL_EXECUTIONS_TO_WORKERS: ${OFFLOAD_MANUAL_EXECUTIONS_TO_WORKERS}
  N8N_RUNNERS_AUTH_TOKEN: ${N8N_RUNNERS_AUTH_TOKEN}
  N8N_TASK_BROKER_URL: ${N8N_TASK_BROKER_URL}
  N8N_COMMAND_RESPONSE_URL: ${N8N_COMMAND_RESPONSE_URL}
  N8N_TASK_BROKER_PORT: ${N8N_TASK_BROKER_PORT}

x-n8n-common: &n8n-common
  image: n8nio/n8n:latest
  user: root:root
  restart: unless-stopped
  links:
    - postgres
    - redis
  networks:
    - backend
  depends_on: &depends-on-defaults
    redis:
      condition: service_healthy
    postgres:
      condition: service_healthy
  healthcheck:
    test: ["CMD-SHELL", "wget -qO- http://127.0.0.1:5678/health || exit 1 "]
    interval: 5s
    timeout: 5s
    retries: 1
    start_period: 30s

services:
  redis:
    image: redis
    container_name: redis
    restart: unless-stopped
    command: redis-server --save 60 1 --loglevel VERBOSE --requirepass ${QUEUE_BULL_REDIS_PASSWORD}
    volumes:
      - redis_data:/data
    ports:
      - "6379:6379"
    networks:
      - backend
    healthcheck:
      test: ['CMD', 'redis-cli', 'ping']
      interval: 1s
      timeout: 3s

  postgres:
    image: postgres
    container_name: postgres
    restart: unless-stopped
    environment:
      - POSTGRES_DB=${POSTGRES_DB}
      - POSTGRES_USER=${POSTGRES_USER}
      - POSTGRES_PASSWORD=${POSTGRES_PASSWORD}
      - PGDATA=${PGDATA}
    volumes:
      - postgres_data:/var/lib/postgresql/data
      - ${SETUP_ROOT_FOLDER}/postgres/init-data.sh:/docker-entrypoint-initdb.d/init-data.sh
    ports:
      - 5432:5432
    networks:
      - backend
    healthcheck:
      test: ['CMD-SHELL', 'pg_isready -h localhost -U ${POSTGRES_USER} -d ${POSTGRES_DB}']
      interval: 10s
      timeout: 10s
      retries: 5
      start_period: 30s

  n8n:
    <<: *n8n-common
    container_name: n8n
    environment:
      <<: *n8n-env
      N8N_RUNNERS_MODE: ${N8N_RUNNERS_MODE_SERVER}
    volumes:
      - n8n_data:${N8N_ROOT_FOLDER}
    ports:
      - "5678:5678"
      - "5679:5679"

  n8n-worker:
    <<: *n8n-common
    container_name: n8n-worker
    command: worker
    environment:
      <<: *n8n-env
      N8N_CONCURRENCY_PRODUCTION_LIMIT: 10
      N8N_GRACEFUL_SHUTDOWN_TIMEOUT: 300
      N8N_RUNNERS_MODE: ${N8N_RUNNERS_MODE_INTERNAL}
    volumes:
      - n8n_worker:${N8N_ROOT_FOLDER}
    depends_on:
      n8n:
        condition: service_healthy
      <<: *depends-on-defaults

  n8n-webhook:
    <<: *n8n-common
    container_name: n8n-webhook
    command: webhook
    environment:
      <<: *n8n-env
      N8N_RUNNERS_MODE: ${N8N_RUNNERS_MODE_INTERNAL}
    volumes:
      - n8n_webhook:${N8N_ROOT_FOLDER}
    depends_on:
      n8n:
        condition: service_healthy
      <<: *depends-on-defaults
Thanks @King_Samuel_David . I will note these and will follow in case of further issues
2 Likes
Nice, this is what I use, a few extra for admin work.
version: '3.8'

volumes:
  db_storage:
  n8n_storage:
  redis_storage:
  pgadmin_data:
  prometheus_data:
  grafana_data:

x-shared: &shared
  restart: always
  image: docker.n8n.io/n8nio/n8n
  environment:
    - DB_TYPE=postgresdb
    - DB_POSTGRESDB_HOST=postgres
    - DB_POSTGRESDB_PORT=5432
    - DB_POSTGRESDB_DATABASE=${POSTGRES_DB}
    - DB_POSTGRESDB_USER=${POSTGRES_NON_ROOT_USER}
    - DB_POSTGRESDB_PASSWORD=${POSTGRES_NON_ROOT_PASSWORD}
    - EXECUTIONS_MODE=queue
    - QUEUE_MODE=redis
    - QUEUE_BULL_REDIS_HOST=redis
    - QUEUE_BULL_REDIS_PORT=6379
    - QUEUE_HEALTH_CHECK_ACTIVE=true
    - N8N_ENCRYPTION_KEY=${ENCRYPTION_KEY}
    - N8N_ENFORCE_SETTINGS_FILE_PERMISSIONS=true
    - N8N_HOST=localhost
    - N8N_PORT=5678
    - N8N_PROTOCOL=http
    - N8N_BASIC_AUTH_ACTIVE=true
    - N8N_BASIC_AUTH_USER=${N8N_USER}
    - N8N_BASIC_AUTH_PASSWORD=${N8N_PASSWORD}
    - N8N_LOG_OUTPUT=file
    - N8N_METRICS=true
  links:
    - postgres
    - redis
  volumes:
    - n8n_storage:/home/node/.n8n
  depends_on:
    redis:
      condition: service_healthy
    postgres:
      condition: service_healthy

services:
  postgres:
    image: postgres:16
    restart: always
    environment:
      - POSTGRES_USER
      - POSTGRES_PASSWORD
      - POSTGRES_DB
      - POSTGRES_NON_ROOT_USER
      - POSTGRES_NON_ROOT_PASSWORD
    volumes:
      - db_storage:/var/lib/postgresql/data
      - ./init-data.sh:/docker-entrypoint-initdb.d/init-data.sh
    healthcheck:
      test: ['CMD-SHELL', 'pg_isready -h localhost -U ${POSTGRES_USER} -d ${POSTGRES_DB}']
      interval: 5s
      timeout: 5s
      retries: 10

  redis:
    image: redis:6-alpine
    restart: always
    volumes:
      - redis_storage:/data
    healthcheck:
      test: ['CMD', 'redis-cli', 'ping']
      interval: 5s
      timeout: 5s
      retries: 10

  n8n:
    <<: *shared
    ports:
      - 5678:5678
    user: root

  n8n-worker:
    <<: *shared
    command: worker
    depends_on:
      - n8n

  redisinsight:
    image: redislabs/redisinsight:1.14.0
    container_name: redisinsight
    ports:
      - "8001:8001"
    restart: always
    depends_on:
      redis:
        condition: service_healthy

  bull-board:
    build:
      context: .
      dockerfile: Dockerfile.bullboard
    container_name: bull-board
    ports:
      - "3002:3002"
    environment:
      - REDIS_HOST=redis
    depends_on:
      redis:
        condition: service_healthy

  pgadmin:
    image: dpage/pgadmin4
    container_name: pgadmin
    restart: always
    ports:
      - "5050:80"
    volumes:
      - pgadmin_data:/var/lib/pgadmin
    environment:
      PGADMIN_DEFAULT_EMAIL: [email protected]
      PGADMIN_DEFAULT_PASSWORD: admin
    depends_on:
      postgres:
        condition: service_healthy

  prometheus:
    image: prom/prometheus
    container_name: prometheus
    restart: always
    ports:
      - "9090:9090"
    volumes:
      - prometheus_data:/prometheus
      - ./prometheus.yml:/etc/prometheus/prometheus.yml
    command:
      - '--config.file=/etc/prometheus/prometheus.yml'
    depends_on:
      - n8n

  grafana:
    image: grafana/grafana
    container_name: grafana
    restart: always
    ports:
      - "3003:3000"
    volumes:
      - grafana_data:/var/lib/grafana
    environment:
      - GF_SECURITY_ADMIN_USER=admin
      - GF_SECURITY_ADMIN_PASSWORD=admin
    depends_on:
      - prometheus
FROM node:18-alpine

WORKDIR /app

# Install all necessary packages
RUN npm install express @bull-board/api @bull-board/ui @bull-board/express bull ioredis

# Add the minimal express server
COPY server.js .

EXPOSE 3002

CMD ["node", "server.js"]
Thanks for sharing ure too, this is my local dev env.
2 Likes
system
May 25, 2025, 6:17pm
20
This topic was automatically closed 7 days after the last reply. New replies are no longer allowed.