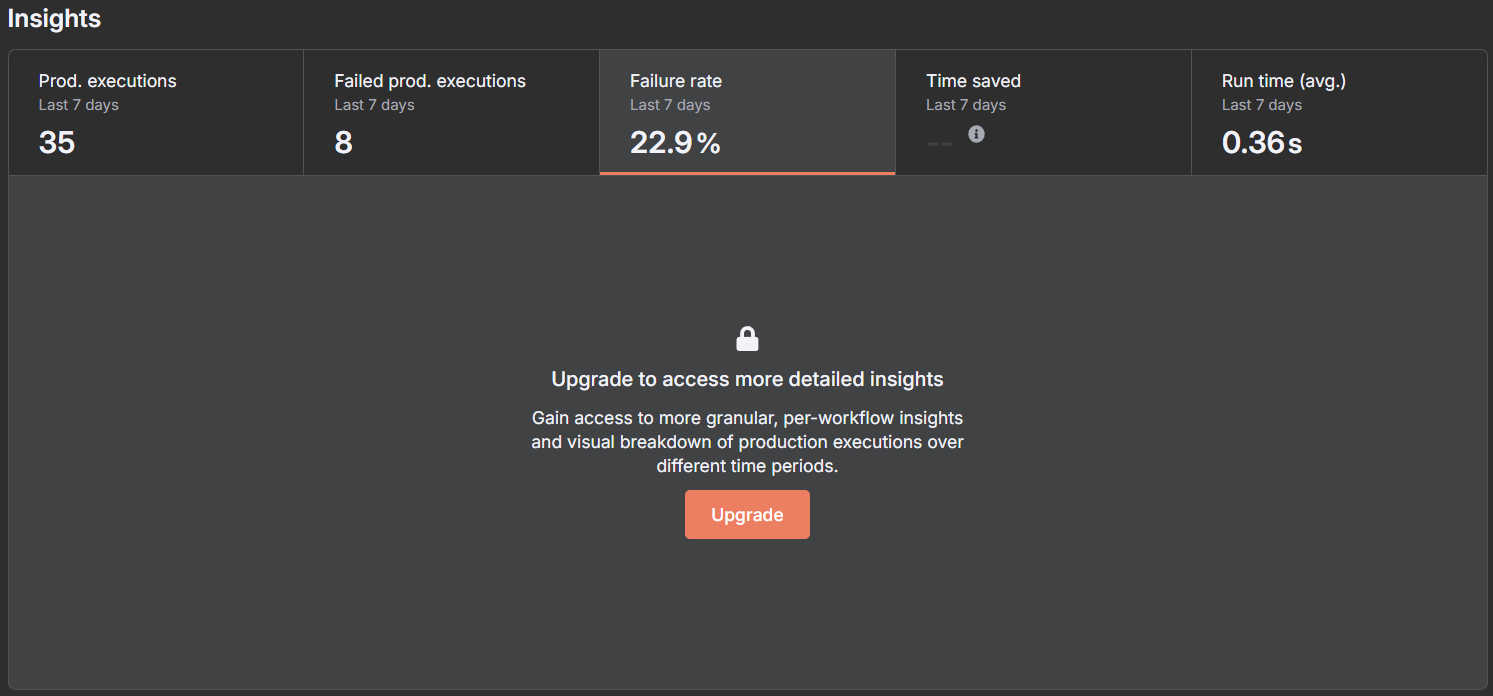
I’m looking for a way to plot some charts about my workflows statistics.
I really would like to know how many time a workflow get called in a certain amount of time and plot some charts.
Sadly this kind of information exists if and only if you save execution history, I’ve disabled it for every workflows because I prefer to save up execution space. I don’t need to know the errorred node and the data passed I just want to know the number of time that workflow have been called.
Analysis
Digging in the api I didn’t find anything but the api to extract workflow history. I’ts disable so not very useful in my situation.
Searching on the database I’ve spot some promising fields.
table workflow_statistics
This table have a count filed that seems very good. If I take hourly snapshot of this number I can create a chart with the number of time the workflow have been called.
Sadly there is no node to interrogate the database of n8n and I don’t see any endpoint to retrieve this information. I’m not even 100% sure if this counter effectively count this.
Question
Did you face this challenge? How did you solve it?
Do you have any advice?
Technically, I could do this, but I’d rather not let my workflow access my n8n instance directly. There are potential concerns, for example, secrets might not be securely stored in the database, or there could be issues with improper access.
If I can’t find a better solution, I could theoretically mount the relevant folder and access the DB directly. But ideally, I’d prefer to have a dedicated node handle that for me.