[BUG] Workflow executions are not shown on UI

Describe the issue/error/question

I am working on a n8n project, I isntalled it fresh on this server. On any workflow, if I click on “execute workflow” and trigger the workflow, the process of the execution is NOT shown on the UI. It does get processed, but I can’t see it on the workflow editor. I can watch it on the “Executions” tab. It is a serious problem because I can’t develop the workflow as I can’t refer to nodes input data on other nodes.

I’ve made a video to show it:

Information on your n8n setup

  • n8n version: 0.170.0
  • Database you’re using: SQLite
  • Running n8n with the execution process [own(default), main]: (I don’t know what it means)
  • Running n8n via [Docker, npm, n8n.cloud, desktop app]: docker

Hey @ruccc, are you using a reverse proxy server of any kind that might intercept some of the traffic? If so, could you share its configuration?

Another alternative, more unlikely than the reverse proxy but still possible. Do you maybe have some kind of firewall or similar that could block it?

Hello @MutedJam ! Just updated cloud version to latest stable 1.69 and seems like same thing is happening. In-Process executions are not showing in UI until they finish and show success or error. It was really good to be able to see these executions sort of monitor the load on my cloud version. Please let me know if some config or maybe really a bug.
Thanks!

Hey @pradilla, many thanks for reporting this! Just tested this and it does indeed seem like running executions don’t show up in the execution list anymore :frowning:

I’ll add this to our bug tracker for a closer look. This looks like a different error from the one originally described by @ruccc though.

Yes, it looks different, as I never get it to an end.

It has a NGINX and a AKPROXY. It doesn’t have any firewall they told me. Two things I have noticed:

On Firefox console I get this error when entering to one of the worfklows on n8n. I don’t get this error en Chrome:

Can't establish connection with the server at https://n8n.domain.com/rest/push?sessionId=xxxxxx. app.10cb2cfe.js:1:281913

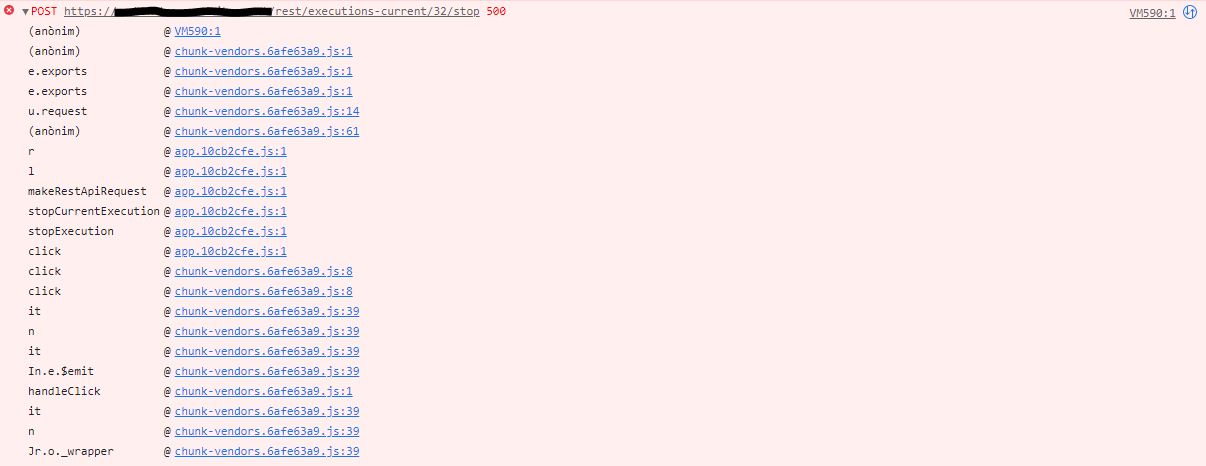
When manually executing a workflow I don’t see any errors on the Firefox console, neither on Chrome. But when stopping an on-going execution (they never stop by theirselves) I get this error both on Firefox and Chrome:

POST https://n8n.domain.com/rest/executions-current/32/stop ERROR 500

Also, on the n8n logs I see this:

{"level":"debug","message":"Executing hook (hookFunctionsPush)","metadata":{"executionId":"32","file":"WorkflowExecuteAdditionalData.js","function":"workflowExecuteAfter","sessionId":"vg54a1x4uw","timestamp":"2022-04-05T15:28:31.805Z",">
{"level":"debug","message":"Save execution progress to database for execution ID 32 ","metadata":{"executionId":"32","file":"WorkflowExecuteAdditionalData.js","function":"workflowExecuteAfter","timestamp":"2022-04-05T15:28:31.805Z","wor>
{"level":"debug","message":"Send data of type \"executionFinished\" to editor-UI","metadata":{"dataType":"executionFinished","file":"Push.js","function":"send","sessionId":"vg54a1x4uw","timestamp":"2022-04-05T15:28:31.806Z"}}
{"level":"debug","message":"Wait tracker querying database for waiting executions","metadata":{"file":"WaitTracker.js","function":"getwaitingExecutions","timestamp":"2022-04-05T15:29:09.287Z"}}
{"level":"debug","message":"Wait tracker querying database for waiting executions","metadata":{"file":"WaitTracker.js","function":"getwaitingExecutions","timestamp":"2022-04-05T15:30:09.306Z"}}

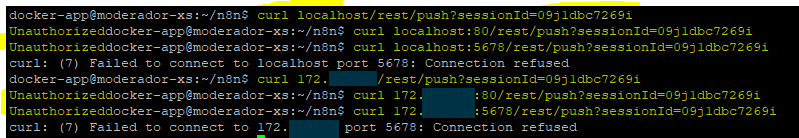
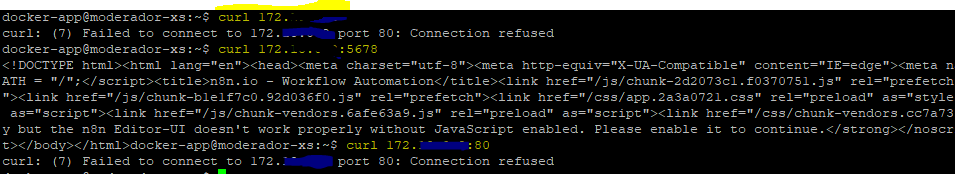
So, it looks like for some reason /rest/push is not loading on the browser (although Chrome doesn’t seem to have this error), and so when n8n tells the browser “Execution finished” it doesn’t receive it.

@ruccc as there is no firewall could you do a connection directly to the container using the IP and port 5678 and see if you get the same issue? If that works then it would be the proxy or the configuration of n8n and we will be able to work what to do next.

The other issue we have reproduced and should have a fix available soon.

I’ve tried this, and that’s what I get:

And if I put the sessionId I get on editor-UI browser, I get an “Unauthorized” message:

Am I doing it right?

Hey @ruccc,

I would just open a browser and go to the IP of the container it would be easier for testing, This of course does assume that there is actually no firewall, If that doesn’t work you could open an SSH tunnel and access it that way.

You are getting the unauthorized message because no authentication has happened.

I got the IP of the container with this command (is it right?):

docker inspect -f '{{range.NetworkSettings.Networks}}{{.IPAddress}}{{end}}' xxxxxxxxxx

This IP is different from the one I was testing before. When going to that IP on browser without any port or with 5678 port, I get a Timeout error.

BUT when doing a curl command to that IP from SSH on the same server, I get this:

Hey @ruccc,

Do you know what port and IP the host is using? You can just use that. It looks like it will be port 5678 but I don’t know if your host is using that port as it can be changed.

Hi. I’ve resolved the similar problem in this topic: Telegram Trigger node doesn't catch webhooks, when scenario isn't active

I hope, it will help you.

1 Like

Hello guys, I’m having the same problem here
My version is the 1.18.0

Is there any solution for it?

Hey @SANTTO,

Welcome to the community :cake:

Can you open a new topic and complete the template so we can learn a bit more about the issue you are seeing and your configuration of n8n.

As this post is old now I am going to mark it as closed.