Hey n8n’ers ![]()
Wanted to share with you all the n8n dashboard I built - I’ve built hundreds of workflows in n8n for many different use cases, but I’ve always been frustrated with the dashboard, so I built this initially to scratch my own itch.
I’m sure some of you are in the same boat as me though and will find it useful as well! Here it is: The n8n Dashboard
Read on for more info & visuals ![]()
A quick note about Coda: if you haven’t heard about Coda yet, you should definitely go check it out right now. It’s kind of like if Notion and Airtable had a baby (at least that’s how I’ve heard it described) - it is ultra-powerful because you can connect it to external APIs and tools in order to sync and manipulate data. Crazy! There’s a free plan so costs nothing to get started.
Here are the key pain points that I wanted to address with this dashboard:
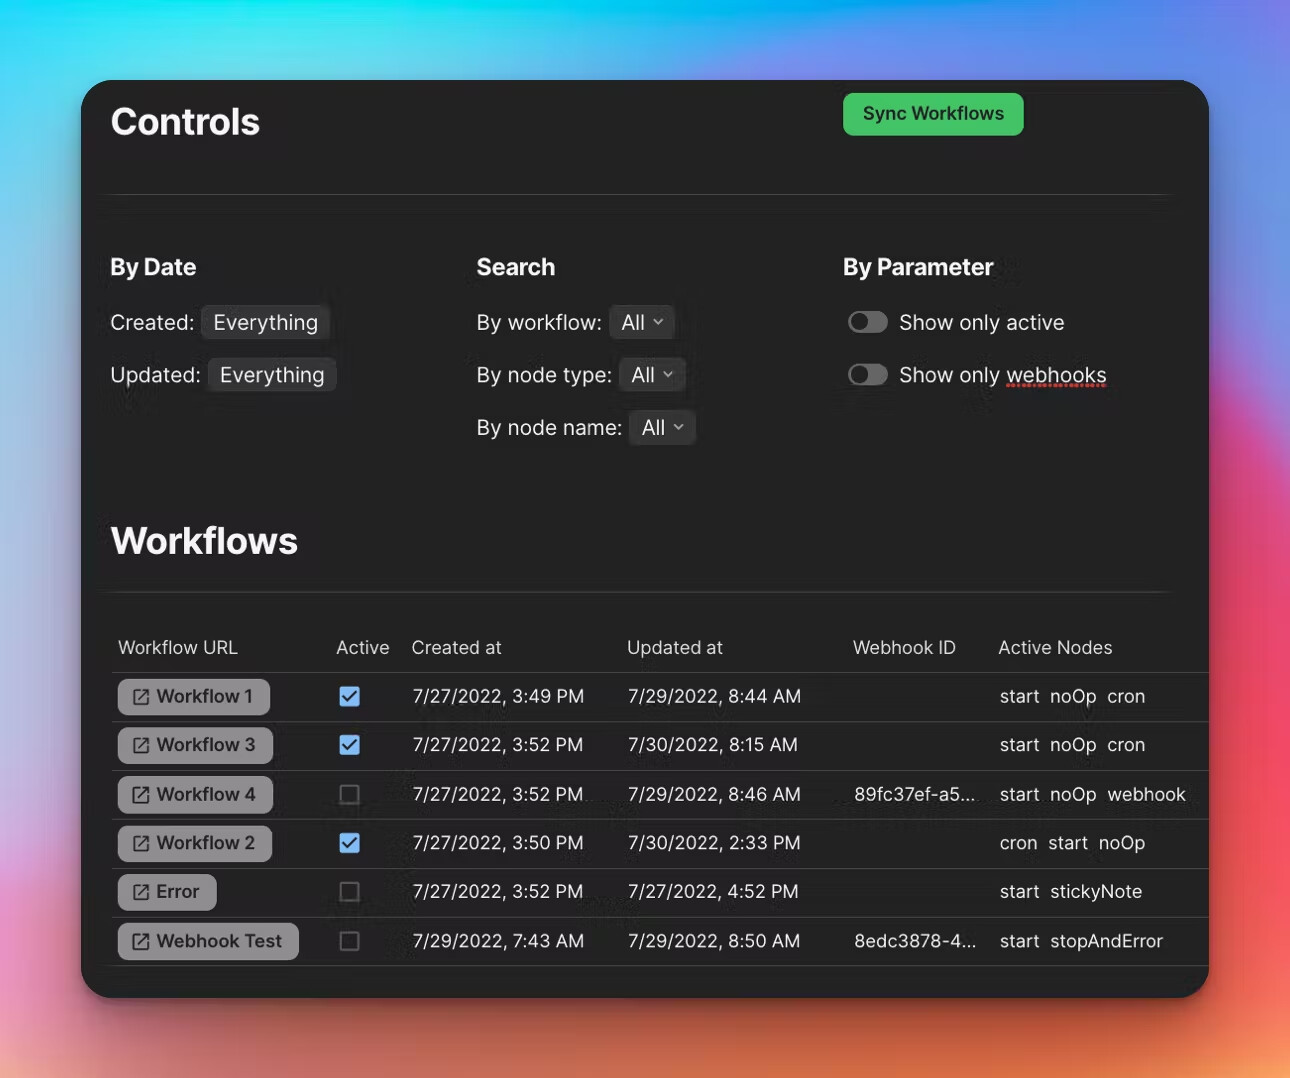
1. Control Panel
(Less of a pain point, more of an essential dashboard feature)
- Activate, deactivate, and delete your workflows from a single place
- Easily and quickly find the exact workflow you’re looking to control
- Emergency button
 to turn off all of them at once

2. Workflows Explorer
(I have 100+ workflows…What was that one workflow that uses the X node?)
(I don’t want to open a workflow just to get the Webhook ID)
- Find workflows easily:
- Filter by active / inactive
- Filter by webhook
- Filter by date created / date updated
- Search by name
- See which workflows are using which nodes
- Find webhook IDs directly from here
- Open any workflow in n8n with one click
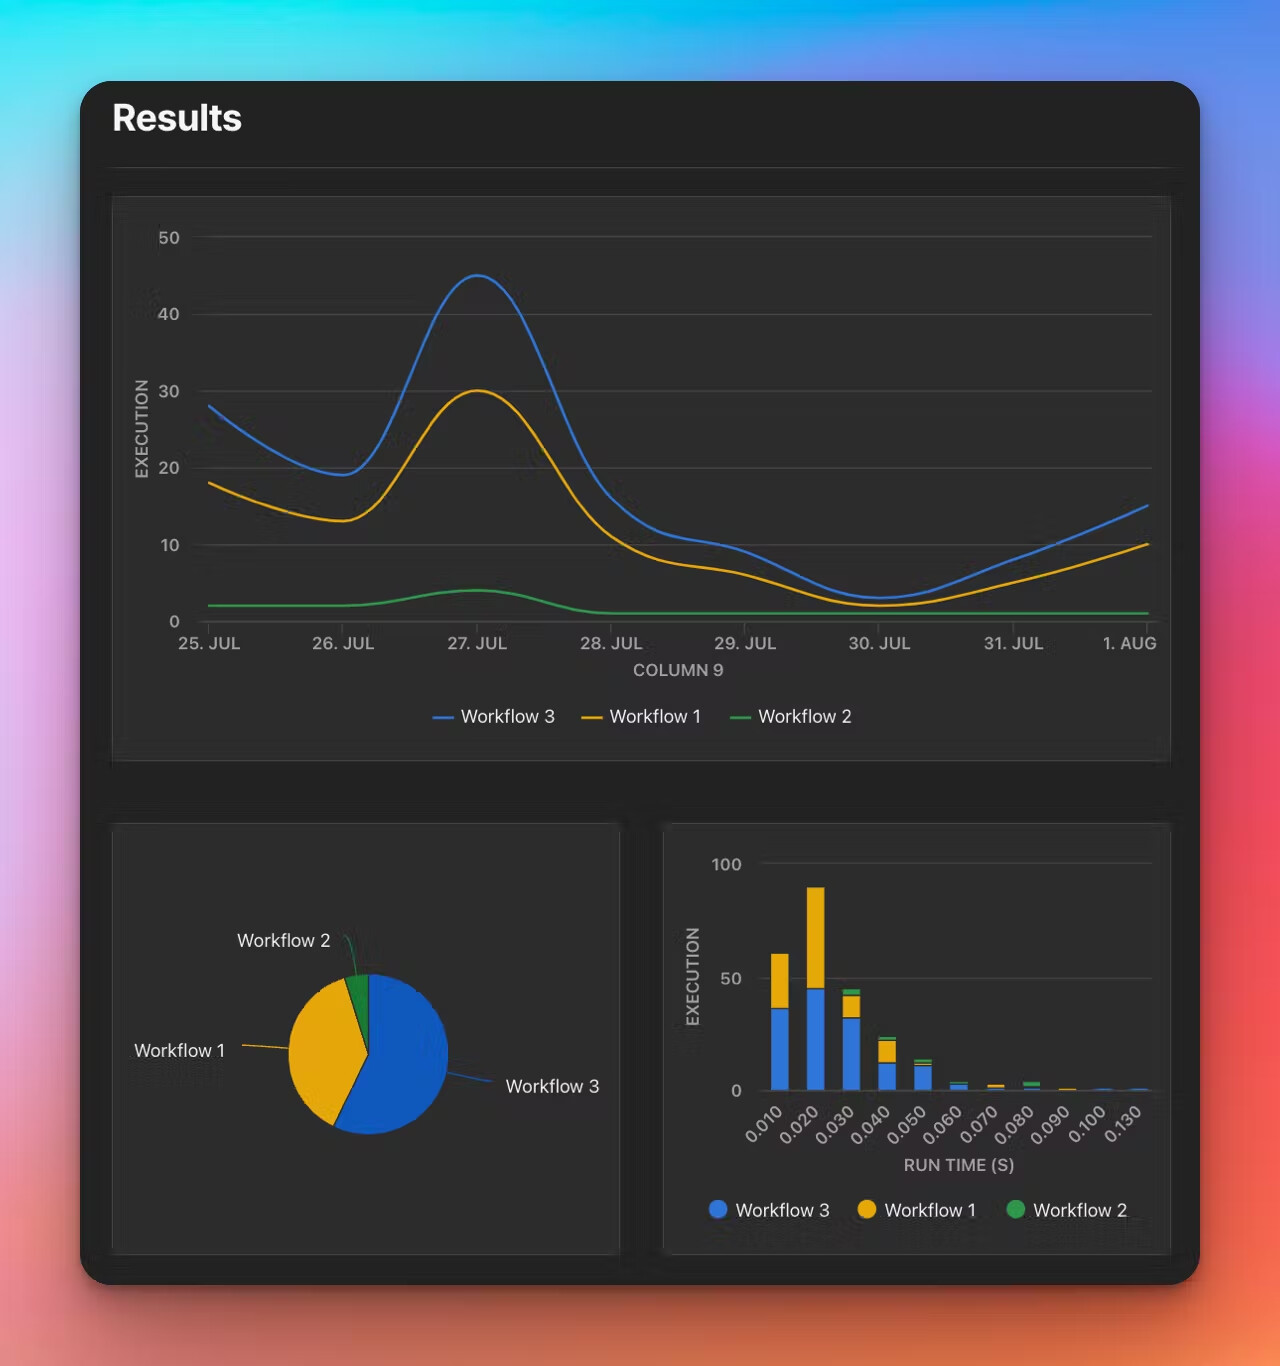
3. Executions Summary
(Is there anything abnormal going on with any of my workflows?)
(How many times is Workflow X executing each day over the last 2 weeks?)
- Get a high level health check of your latest executions to quickly identify issues and trends
- See how many times each workflow is executing per day, over a given period of time
- See the distribution of execution run-time for each of your workflows
- See the split of executions across your workflows for a given time period
4. Run History
(I want to see all executions of Workflow X that ran longer than 10 seconds to debug them.)
(I want to see all executions that errored out in the last 5 days, review them, and mark them as fixed.)
- Find executions easily:
- Filter by run-time
- Filter by mode (trigger, retry, or manual)
- Filter by finished / not finished
- Filter by date
- Filter by workflow
- Isolate only executions with a run time longer than a selected duration
- Open any execution in n8n with one click

For now, this dashboard is free to use!
But some time in the next couple of months, I’ll start charging a small fee for the Pack that powers it - nothing crazy, probably something like $3-4 per month. Maybe will have a freemium model so light users can still use it for free, while power users like myself can pay to sync more executions, have more advanced features.
Happy to connect with any of you regarding getting started on Coda or any q’s / feature suggestions for the dashboard. Either here or find me on Twitter!