When using the n8n UI, after 5-10 minutes, typing in any text field becomes unbearably slow. This has been happening for a while, but it’s gotten to a point of productivity-blocking that I have to say something.
What is the error message (if any)?
No error messages, just a significant (3-6 second) delay between text input and response.
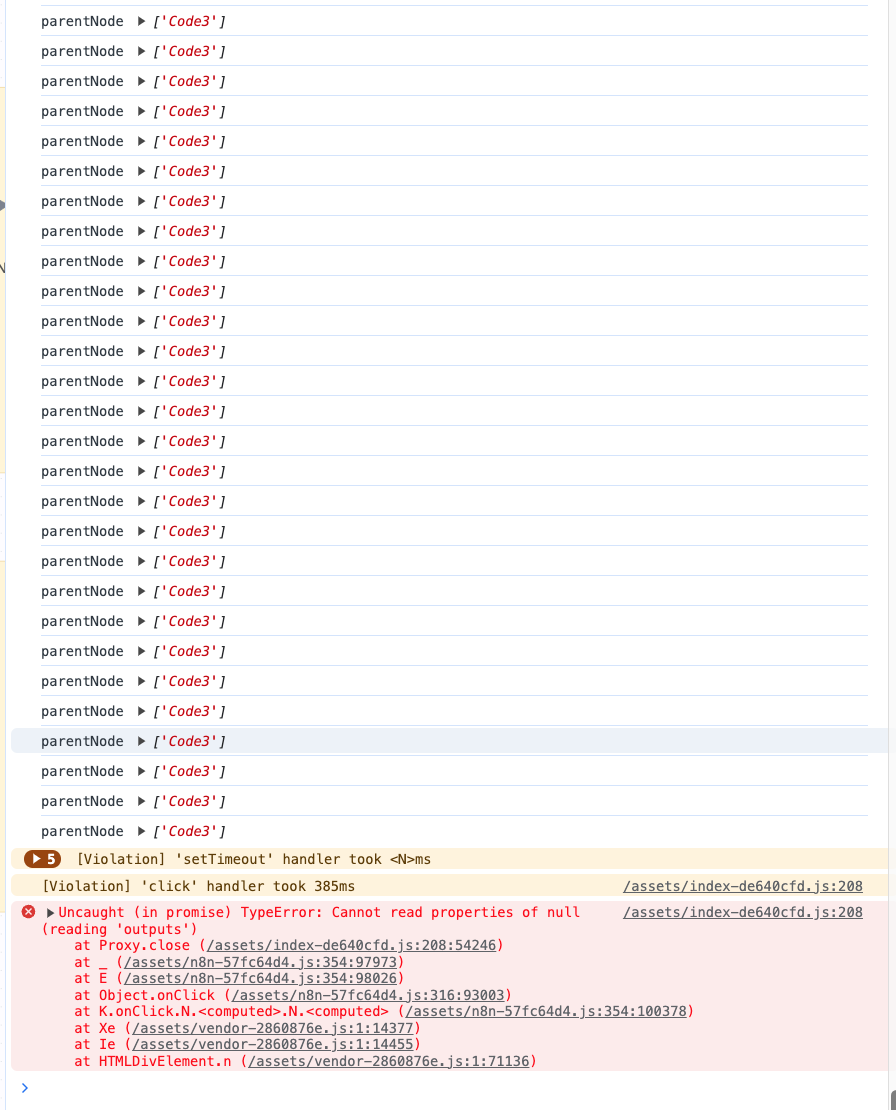
In the Chrome browser console, however, I do see log entries basically at each keystroke:
Nothing of note in the logs, CPU usage of the instance is 5-6%, 1.5 GB of memory free, etc.
I’m unfortunately not able to reproduce this on 1.11.1.
Can you please try this in another browser, to rule out that this is not being caused by some browser plugin?
If you still see those logs in the console, can you please share the right side of the console as well, that says which file the logs are coming from ?
Hi @netroy, thank you so much for the quick response.
I just tried in Safari, same issue, and I disabled all extensions/plugins on Safari when testing.
I don’t get the messages in the console in Safari, but the typing speed is still very laggy… and again, it seems to get worse with time (i.e. seems like a memory leak).
In Chrome, the tab that has been open and is super laggy, I do see a 1.3 GB memory footprint in the task manager.
Regarding your request for the ‘right side of the console’, I’m sorry but I can’t quite figure out what you mean. When there is an error or a warning, I do see the filepath, but not when it’s a simple .log().
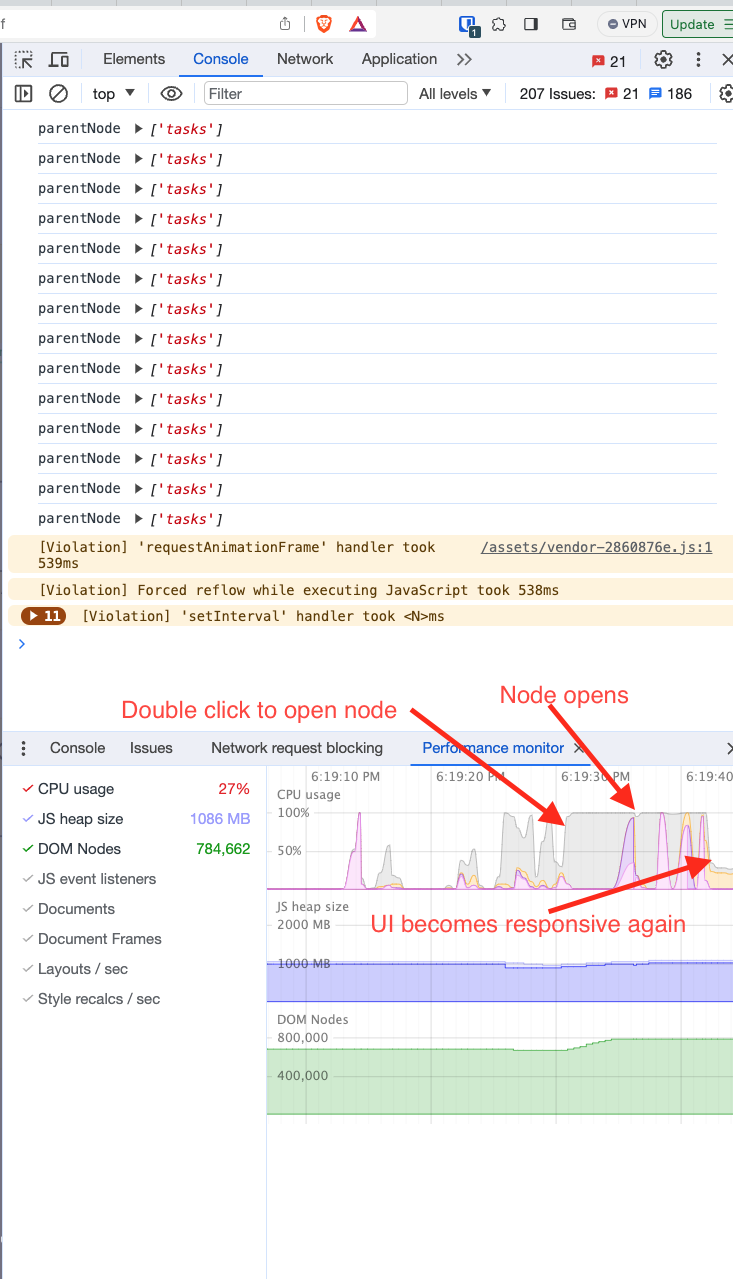
Lastly, I opened the new “Performance Monitor” in Chrome, and I see huge CPU usage when typing, or really, when doing anything in the UI (opening a node takes 12 seconds during which the CPU is pegged at 100%).
Thanks a lot for that detailed reply.
Does this happen after you have some manual execution data in some previous nodes? or does this happen right after opening the workflow without any execution data?
It’s still slightly slow and laggy when opening in a fresh tab, and it gets progressively worse as I start to work through the workflow. I’m currently trying to make one of the final nodes work, and so I am running the previous ones via manual executions to have the data needed for the final node.
Even after running all nodes, it’s still not “ultimate lag” status- that comes when I’ve been working on things for a while.
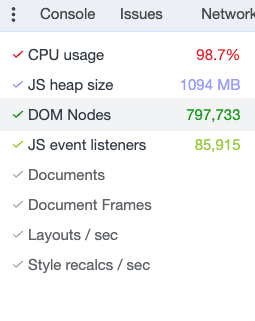
On a whim, I decided to check how many JS event listeners were registered… there’s over 75k+!!!
Reddit.com has 4,000, and it’s one of the worst performing websites I know. N8n.io has 1,105, github.com has 8,600.
This behavior definitely ‘feels’ like JS thread blocking to me. Is there something (a node, a config, etc.) that could be creating duplicate or erroneous JS event listeners.
Notes:
If I navigate to another workflow, and wait, something like GC kicks in and it goes back down to 4-7k.
Navigating back to the original workflow, the event listeners stay low, and the UI is slow but responsive.
As I continue using the workflow, I’m seeing the number of event listeners climb by 2-3k each time I open a node, and doesn’t go back down when closing it. As I’m doing this, the UI is getting laggier and laggier.
Refreshing the page drops the JS heap size and event listeners down HUGELY.
Edit: I can confirm that the lag on the UI is directly proportional to the # of event listeners.
I’ve struggled with performance in the past but haven’t really seen it for a long time.
Have you tried re-creating the entire workflow - node for node - in a new flow. Just copy one node at a time? I still see mysterious bugs now and then that can only be solved by starting from a fresh.
Hey @systemaddict I know exactly what you’re talking about, I’ve had to do the same myself. It seemed relayed to ‘ghost’ parameters that were dangling after deleting a field that previously held a value… but yes, I know what you’re talking about.
If I’m really the only one experiencing this, I’ll give it a shot…
We have the same problem in n8n version 1.14.2 . We haven’t found a solution yet other than dividing the scenarios into smaller ones. Slow UI in big scenarios
This is one of those issues that we will fix but to fix it we need to be able to reproduce it first. Do you have any steps you normally take to reproduce the issue or does your workflow have lots of nodes or thousands of items in it?
It happens in lots of flows… but not all flows. Perhaps the common denominator is the GPT node? This is one flow that I work with regularly… it affects all the nodes, but it’s worst in the GPT node.
I did try changing the GPT node out for a web HTTP request, and it didn’t affect the poor performance. But i didn’t try re-creating the flow.
In the attached video, I haven’t run the flow at all in this example since loading it. Nothing should be pre-loaded.
As you can see, as soon as i start typing, it maxes out the CPU in the browser and takes a good 5 - 10 seconds to populate the text to the screen.
Regularly, that particular flow is triggered by a webhook with a single JSON item, which has around 100 key values in it—definitely one of the smaller flows.
I tried with switches and if statements separately, as another thread mentioned that switches cause delays. But it made no difference.
In the attached video, you can see I start typing at 3 seconds; the Task Manager maxes out in the browser, and then at 11 seconds, the text appears in the box.
It could be down to the expressions, I have seen a couple of javascript functions in expressions cause issues in the past and I think someone reported an issue with using .reverse() causing the UI to crash. Would you be able to share both of the fields you have in the GPT node or DM them to me if it is a prompt that you want to keep secret so I can do some tests with the values?
Hi,
I have similar experience, when I’m dealing with many rows. I usually use n8n on my docker container. However, I registerd on n8n cloud and copy my workflows to test this out. I tested this on chrome and firefox. Same problem. My test workflow contains only 4 nodes with around 2k items. After clicking “test workflow” UI is very slow. Typing something takes the couple of seconds.
Perhaps not too useful… but me too, I was writing some code node, around 30 lines, takes multiple seconds to enter a single letter. As a work around I first write the code in my editor, then copy/paste to taste in n8n.