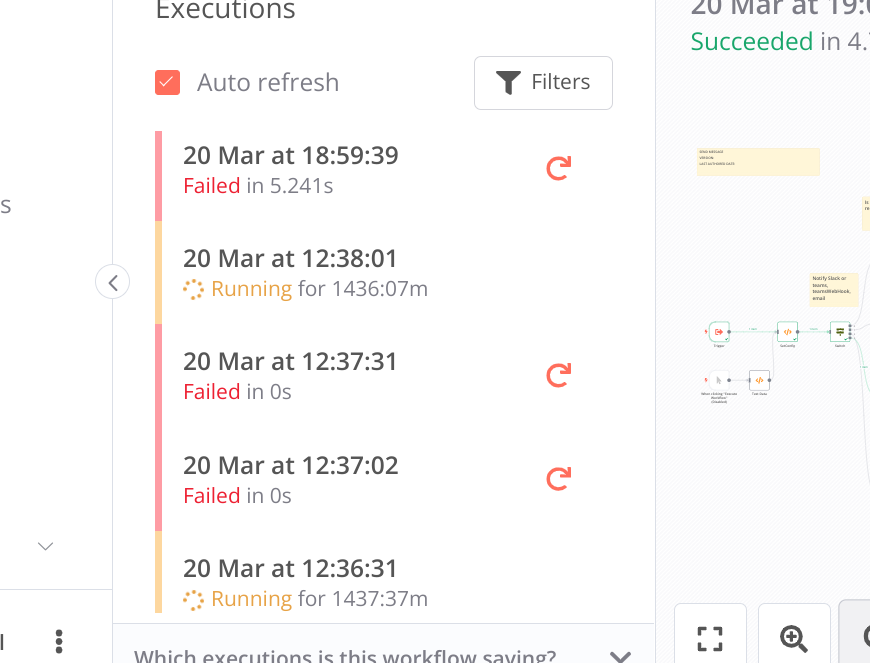
I have been having trouble with workflows supposedly Running for 0s or 1000+ minutes.
It started happening around the release: 0.216.2. I thought I could revert to a backed up database where they didn’t start running and update to the newest release, which worked for a while, but they still appear when I access the “Running/Failed” executions filter.
The “Running” executions only appear (and only in a number of few) when I switch to “Failed” executions filter view for example and when I switch to “Running” or “Failed”, the CPU and DISK IOPS resources start working heavily which result in the UI not loading. I have to either restart the instance/server or wait for about an hour. When I wait for an hour, the heavy resource use stops and I can see those workflows Running 0s appear the moment it stops.
They don’t seem to take any resources when I stay away from those filtered views, but this way it’s much more difficult to monitor if everything is working properly.
The 0.218.0 release had a bug fix: “Prevent executions from displaying as running forever.” which I thought had addressed the issue, but my issue might be different.
I also tried duplicating one of the workflows and deleting the one that had a few executions still Running in the Executions history, but the duplicated one also started having the same issue.
I am running version 0.219.1 self-hosted docker instance on Hetzner.
Hi @Rafix, I am sorry you’re having trouble. It sounds like you might have ended up with your n8n database in an unexpected state (though it’s hard to say for sure without an exact history of the up- and downgrade actions performed)
Could you (temporarily) try using a fresh database, just to verify whether this is indeed a problem with your specific database?
You could also try using the n8n db:revert CLI command suggested here for example using your original database (it’s not a documented command though, so you would want to take a backup beforehand just in case).
I forgot to mention that when I try to stop the Running executions, I get an error: " Problem stopping execution The execution ID “number” could not be found.
I also noticed that with those Running executions multiplying when I open the “Failed/Running” executions filter, my database is growing rapidly, but there’s no surprise there.
So it’d be good to see whether this is indeed related to a discrepancy between the database structure you currently have and the n8n version you’re running.
I’m also noticing the same issue possibly on 0.219.1 and upgrade to release 0.220.0 on Saturday , don’t think I’ve seen any issues since but still the ‘running’ entries exist.
Hey @0101binary0101 so far I am just guessing here. The db migration adding new fields to old executions can be very slow if there is a large number of executions, so I can imagine this being interrupted in some cases. I am, however, not able to reproduce the problem based on the information provided so far. I too am running [email protected] with a PostgreSQL db but didn’t notice any such problem.
Are you also seeing this problem when temporarily switching to a clean database, and then importing and testing your workflows?
I might be able to switch DB’s - it’s a bit of task to do so (only switched to postgres mid last-week) , Do you think pruning out the executions would do it ? I was considering this:
as mentioned I too was originally running 0.219.1 as per @Rafix … so I’m guessing since going to 0.220.0 it hasn’t re-occurred apart from having those residual entries.
So my best guess is that n8n can’t determine the status of these executions because some of the rows in your database don’t look as expected.
Seeing this only affects old executions for you from the sounds of it, it might not be worth spending too much time on this tbh (and testing a blank db wouldn’t actually help, seeing it’s already working again for new executions anyway). I’d suggest you simply remove these old executions by running a query such as this one (adjust as needed and make sure to take a backup beforehand just in case):
DELETE FROM execution_entity WHERE "startedAt" < now() - interval '1 day';
Going forward, it certainly is a good idea to configure data pruning. You’d only need the first two variables though, the …VACUUM_ON_STARTUP one is only required for SQLite.
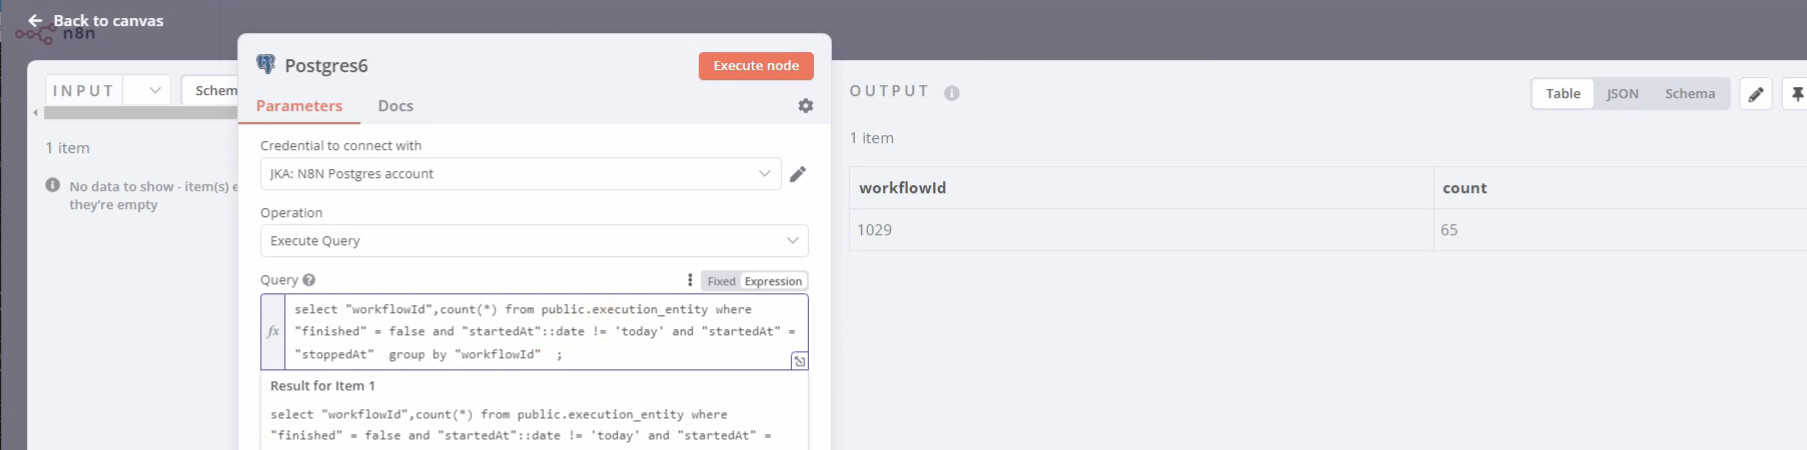
My SQL isn’t great but with help from others after examining the execution_entity table managed to come up with this query for identifying stuck running executions across ALL the workflows:
select "workflowId",count(*) from public.execution_entity where "finished" = false and "startedAt"::date != 'today' and "startedAt" = "stoppedAt" group by "workflowId" ;
The key bit appeared to be that startedAt and stoppedAt had the same datetimestamp, and finished was still ‘false’ - I had OLD 65 entries on 1 workflow, that appeared to be in this stuck ‘running’ state on the ‘17th and 20th’ :
How they were removed was a modify of the query, based upon your syntax but keeping it to the start of the day, obviously check the Identified entries first before executing the delete:
delete from public.execution_entity where "finished" = false and "startedAt"::date != 'today' and "startedAt" = "stoppedAt" ;
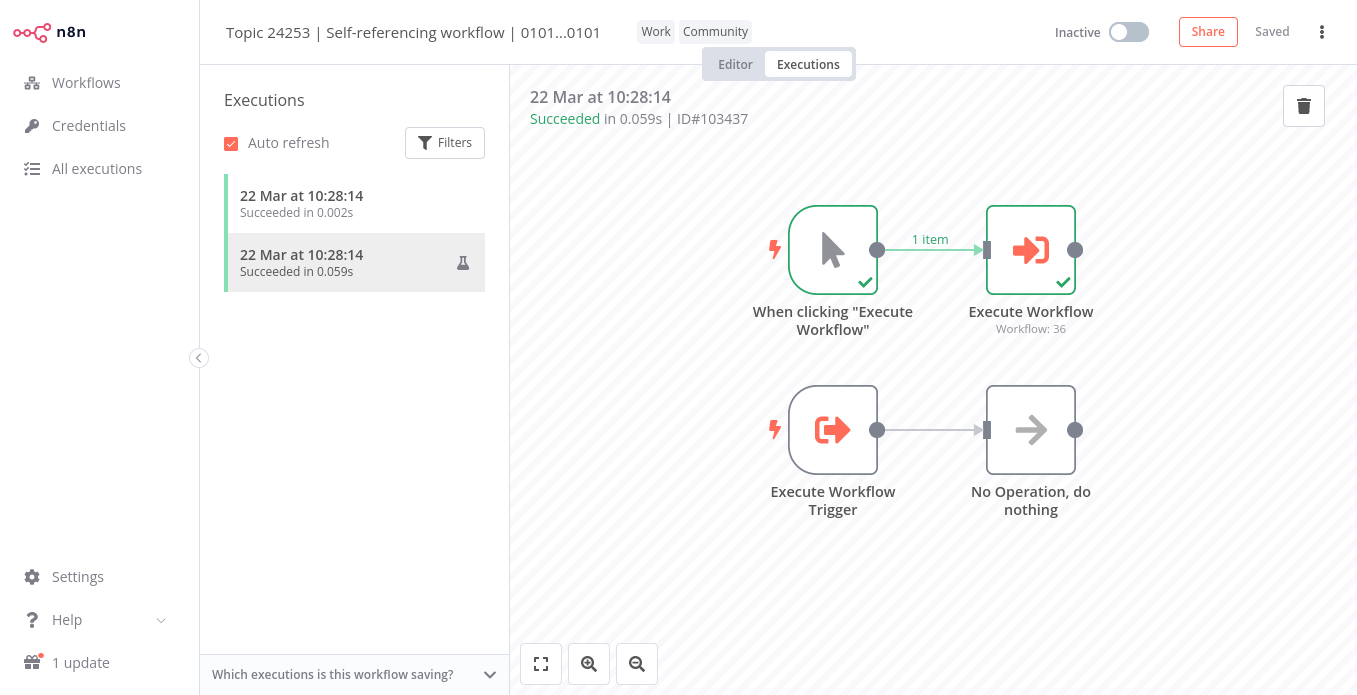
How they got into this state - I’m investigating if it was because this specific workflow has an ‘Execute workflow trigger’ that calls itself via an execute workflow node (in the same workflow, rather than a ‘link’ back to the start). There are clearly defined paths in the workflow that should mean it should have finished and returned back to itself and carried on the workflow before finishing. So maybe n8n has some ‘funnies’ with self referencing Execute workflows ???
So I just created a self-referencing workflow like this:
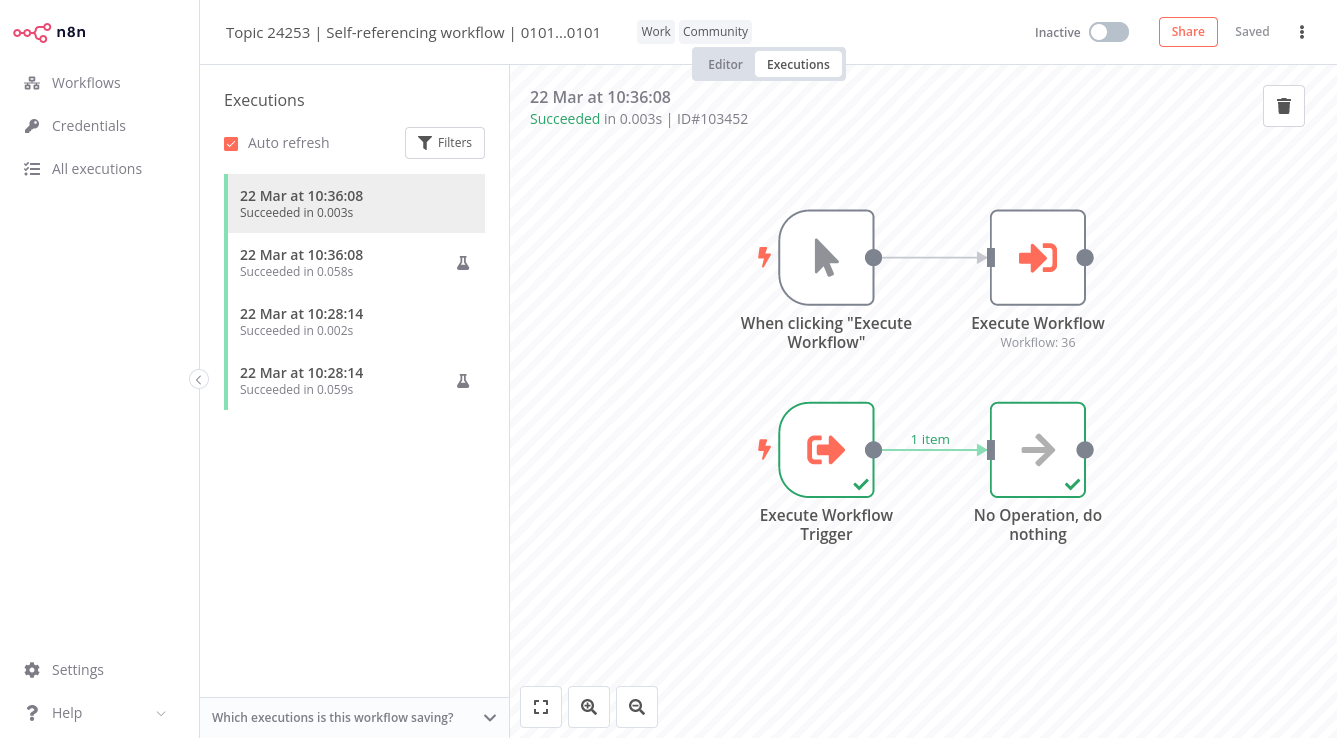
I’ve also enabled storing pretty much all execution data and couldn’t see any problem. The first two executions are on [email protected] (one manually triggered, the other triggered through “Execute Workflow”):
So I wouldn’t fully rule out such a problem, but it doesn’t seem to be super widespread. If you have a reproducible example for the latest version that’d be very helpful.
Thanks for looking at that. My long running executions may have been side-effects during testing of my implementation to get around the webhook/wait node not waiting in a child workflow OR just thinking about it …my workflow can also be called from my ‘error trigger workflow’
Thank you @MutedJam and @0101binary0101.
With your help, I think I was finally able to delete those pesky executions from the database.
Since I am SQL illiterate, I used DB Browser for running the queries you suggested.
I actually found it easy to find the ones that needed to be deleted in the execution_entity table filtering the view to “finished” = false, and deteled the ones with the “status” = new.
There was also one with “status” = crashed, that took a really long time to load.
I deleted them all, and everything seems to be fine now.
Looking back, I think that the reason it all happened was me trying to update in the middle of migration, back around version 0.216.2.
BTW, there is something weird in the Release notes documentation. The numbers don’t make sense between 0.216.1 and 0.216.2.
Glad to hear this, thank you so much for confirming!
BTW, there is something weird in the Release notes documentation. The numbers don’t make sense between 0.216.1 and 0.216.2.
I think this is intentional as the notes are ordered by date rather than by version number. A few weeks ago we released this fix which was backported to multiple different minor versions which is why the order looks odd. I’m sorry for the confusion this might have caused.
Actually, the Running 0s. started popping up again (in much smaller numbers though, at leas for now) and I think it might have something to do with me opening the “All executions” tab with either Failed/Running filter.
The funny thing is that they are only visible with “All workflows” filter (as “Running 0s”). They are absent in “Running” filtered view. But, when I look into the “executions” of this “Running” workflow, it will be counting minutes.
Another funny thing is that, the process has not been triggered by any action or another process, but they are some of the processes that had the same issue before and, I don’t know if it is a coincidence, they all have Google Workspace triggers.
Anyway, I will be monitoring the situation and let you know if it becomes a nuisance.
At the moment, it immediately stops consuming CPU resources once I exit the “Executions” view, and doesn’t cause any significant trouble.
I’ve just reproduced the issue of the running execution as well. I transferred my ‘big’ subworkflow (with nodes to different messaging nodes) to a different N8N instance that hadn’t had a credentials created for a specific paths and even though that IF path wasn’t used subworkflow errors in the parent and left an execute running in the subworkflow executions, Temporarily disabling the nodes that have ‘no credentials’ means that the subworkflow can execute along a path correctly and not left running.
I’ve reproduced it for a smaller subflow and executed the parent and this example of my instance causes the constant running issue:
Thank you so much for this example, I was now able to reproduce the problem on [email protected]! @Rafix is this also what’s happening for you? A situation where the sub-workflow execution actually fails but that for some reason is shown as running in the executions list?
Looks like this issue also exists on [email protected]. I’ve added this as N8N-6258 to our backlog and we’ll update the thread once it has been fixed @0101binary0101. Sorry for the trouble this causes